
In the age of rapid digital transformation, AI has seeped into almost every industry, revolutionizing how we conduct business, design products, and even create content. The ClusterMagic service is a great example, which seamlessly integrates AI for content generation in a hybrid model, providing significant benefits in the SEO results of brands seeking a massive increase in organic traffic. But while AI holds immense promise, it has its limitations. Let's explore the pros and cons of using AI for content creation and understand why a hybrid approach might be the way forward.
Major publishers in sensitive niches like CNET.com, Bankrate.com, and Creditcard.com have already integrated AI-generated content. Other large companies, such as CNN and Forbes, might also be doing so. Countless smaller companies and publishers are utilizing AI, not only on their websites but also on social media, in email marketing, and virtually everywhere else.
Google's stance on AI-generated content is neutral, emphasizing that content should primarily be user-centric. In fact, Google's September 2023 Helpful Content Update removed the mention of "written by people" from their helpful content system guidelines.
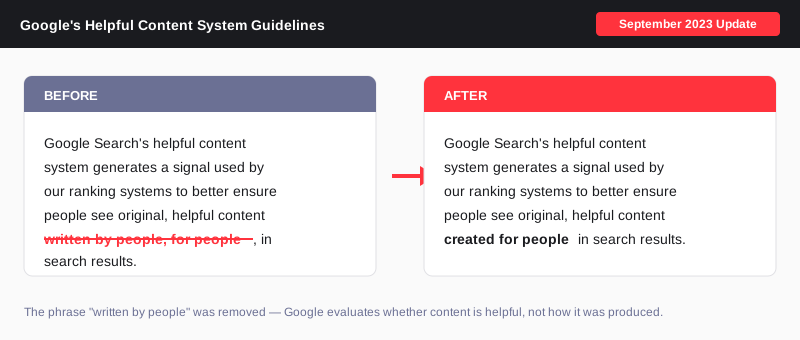
The message is clear: for content to rank well, it must be informative, answer users' queries satisfactorily, and showcase genuine expertise - regardless of how it's created.
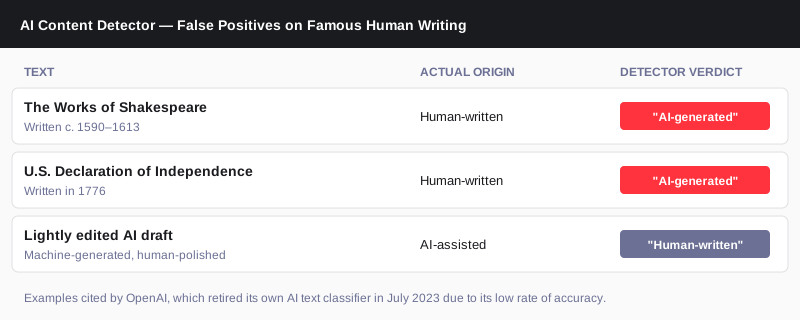
AI Content Detectors like GPTZero, ZeroGPT, and many others are not reliable. Even OpenAI has said as much. They consistently produce false positives about human-written content. Conversely, they can be easily fooled with creative prompting or a bit of human editing.
An interesting note from OpenAI: "we found that it labeled human-written text like Shakespeare and the Declaration of Independence as AI-generated."
Anecdotal evidence and real-life ranking data suggest that while AI-generated content isn't penalized by search engines, it might only achieve high rankings if it meets the above criteria. The role of AI in content creation is still a developing narrative, and its significance is indispensable for maintaining a competitive edge in the future.
At EmberTribe, the understanding is clear - AI serves as a foundation, not the final product. With ClusterMagic, while AI aids in the initial draft based on expert-driven keyword research, human experts step in for the crucial phases of editing, fact-checking, and final review. This hybrid approach ensures the content is accurate and helpful, has the potential to rank, and truly represents their business.

Customer loyalty campaigns return $2.71 for every dollar invested in year one. By year three, that figure compounds to $7.93 per dollar, according to Smile.io's 2025 loyalty benchmark data. The compounding effect is what separates brands that treat loyalty as a retention tactic from those that treat it as a revenue system: the math gets dramatically better the longer the program runs.
This guide covers the campaign types that drive retention, the channel economics behind email, SMS, and referral, what separates tiered programs from flat-rate approaches, and the metrics that tell you whether a loyalty investment is working.
The core dynamic is that loyalty members change their behavior in measurable ways. Members who redeem rewards spend 2.5 times more than non-members, and brands with active loyalty programs see 28% higher customer retention and 18% higher average order value, according to LoyaltyLion's 2025 ecommerce loyalty benchmarks. Higher retention directly reduces reliance on paid acquisition: every customer who makes a third and fourth purchase reduces the customer acquisition cost burden on the next campaign cycle.
The compounding effect comes from behavioral lock-in. A customer tracking toward a tier upgrade or a reward threshold has an active reason to return before the competition reaches them. That friction to switch is structural, not emotional, which makes it more durable than brand preference alone.
The strongest loyalty programs combine multiple campaign types rather than relying on a single mechanism. Each type addresses a different behavioral lever.
Points-on-purchase campaigns are the foundation of most programs and the easiest to execute. Customers earn points per dollar spent and redeem them for discounts or products. The risk is commoditization: if every brand in your category runs a points program, it stops being a differentiator. Points programs work best when the earn rate is generous enough to feel meaningful within one to two purchase cycles.
Tiered programs create aspiration and urgency. Customers at higher tiers receive better earn rates, early access, or exclusive perks, and they are motivated to maintain their tier status even when they do not need to buy. Tiered programs deliver 1.8 times higher ROI than flat points programs, per Ringly.io's loyalty benchmarks, because the tier mechanic increases both purchase frequency and average order value simultaneously.
Referral campaigns are the highest-leverage loyalty investment at the growth stage. Referred customers have a higher lifetime value, lower churn rate, and 16% higher average spend than customers acquired through paid channels, per ReferralCandy's program data. Referral programs reduce new customer acquisition cost by 40 to 60 percent when the reward structure is calibrated correctly, typically a dual-sided incentive where both the referrer and the new customer receive value.
Three additional campaign types address the relationship layer, milestone timing, and win-back mechanics that points and referral programs do not cover on their own.
VIP and early-access campaigns reward top customers with exclusivity rather than purely monetary value. First access to new products, private sales, or direct access to a founder or brand team creates a relationship layer that points programs cannot replicate. Brands in premium and lifestyle categories find that exclusivity perks outperform discount perks for high-LTV customer segments.
Birthday and milestone campaigns activate at natural moments of receptivity. Customers are more likely to convert on a promotional offer during a personal milestone than during a general sale. Klaviyo data shows birthday campaigns generate 481% higher transaction rates than standard promotional emails.
Win-back campaigns target customers who have lapsed beyond their expected purchase window. A well-structured win-back sequence with a time-limited loyalty incentive reactivates 5 to 15% of lapsed customers who would otherwise require full paid acquisition cost to recover. Ecommerce marketing programs that include win-back in the loyalty stack reduce net customer attrition without increasing acquisition spend.
The channel choice for loyalty campaign delivery has significant ROI implications.
Email remains the highest-volume channel for loyalty communication. Customer acquisition through email costs $8 to $15 per retained customer, and email loyalty sequences consistently outperform broad promotional sends in conversion rate and revenue per send, per Baesman's loyalty channel analysis. The limitation is deliverability pressure: loyalty emails in crowded inboxes require strong subject line performance to generate opens.
SMS delivers the highest per-message ROI in the loyalty stack at $71 return per dollar invested, according to Omnisend's 2025 SMS benchmarks. SMS is most effective for time-sensitive triggers: expiring points reminders, tier upgrade notifications, and limited-access sale alerts. The constraint is that SMS lists are smaller than email lists for most brands, and high-frequency SMS fatigue customers faster than email.
Push notifications through a branded app or loyalty platform occupy a middle position: higher open rates than email, lower friction than SMS, but dependent on app install rates that most DTC brands have not achieved at scale.

The 1.8x ROI differential between tiered and flat programs is driven by two mechanics. First, tiered programs create what loyalty researchers call "aspirational spend": customers purchase specifically to reach or maintain a tier status, which increases purchase frequency beyond what they would have done without the tier structure. Second, higher-tier customers receive better earn rates, which compounds the points balance and increases redemption frequency.
Flat programs are easier to implement and communicate, which makes them the right starting point for brands under $2 million in annual revenue that do not have the operational infrastructure to manage multiple tier communications. The migration from flat to tiered is worth building when annual revenue exceeds $5 million and the retention data shows meaningful differences in LTV between high-frequency and low-frequency buyers.
Four platforms dominate ecommerce loyalty infrastructure: Smile.io, LoyaltyLion, Yotpo Loyalty, and Klaviyo's native loyalty tools.
Smile.io covers points, referrals, and VIP tiers with strong Shopify integration and starts at $49 per month. It is the most commonly deployed platform for brands under $5 million in revenue. LoyaltyLion offers deeper analytics and more customizable program structures, starting at $399 per month, and is better suited to brands with complex segmentation needs.
Yotpo Loyalty integrates tightly with Yotpo's review and SMS products, making it the strongest option for brands already in the Yotpo ecosystem. Klaviyo's native loyalty tools are earlier in development but offer the deepest integration with email and SMS flows for brands already on the platform.
Three metrics determine whether a loyalty program is generating returns worth the operational investment.
Redemption rate measures what percentage of earned points or rewards are actually used. A redemption rate below 20% signals that the earn rate is too low or the reward options are insufficiently compelling. A rate above 80% signals that the discount liability may be outpacing the retention benefit.
Repeat purchase rate for members versus non-members is the clearest signal of program effectiveness. If loyalty members are not purchasing at meaningfully higher rates than the baseline, the program is adding cost without changing behavior.
Program contribution to revenue measures what percentage of total revenue flows through loyalty-eligible orders. Brands with healthy programs typically see 40 to 60% of revenue from members after 18 months. Below 20% suggests the program is too small relative to the total customer base to have a meaningful retention impact.
For ecommerce brands building growth programs where retention efficiency compounds over time, EmberTribe works on the demand generation and content programs that fill the top of the funnel while loyalty programs improve the return on each acquired customer.

AI for ecommerce is no longer a future-state conversation. In 2026, 80% of online retailers have integrated AI into their operations, and the majority report measurable revenue impact. The harder question is not whether to use AI, but which applications are mature enough to justify investment right now versus which ones are still more hype than substance.
This post covers five specific use cases, what the data says about each, and where DTC brands are seeing genuine returns versus spending time on tools that are not yet ready for prime time.
Not all AI applications are at the same stage of maturity. Some, like personalized product recommendations, have been refined over years of deployment and have robust ROI benchmarks. Others, like fully autonomous ad campaign management, are still highly variable. The breakdown below focuses on what the data actually shows.
Personalization engines are the most established AI application in ecommerce. A 2025 Forrester Total Economic Impact study commissioned by Optimizely found customers achieved 446% three-year ROI with payback in under six months. BCG's 2025 Personalization Index found that leaders in personalization achieve compound annual growth rates 10 percentage points higher than laggards.
The mechanism is direct: sessions where shoppers engage with AI-powered recommendations show 369% higher average order value compared to sessions without recommendation interaction. Fast-growing companies generate up to 40% more revenue from personalization than slower-growing peers in the same category.
The caveat is that "personalization" covers a wide range of implementations. Showing recently viewed items is not the same as dynamic pricing, individualized email flows, or real-time homepage merchandising. The ROI benchmarks above apply to the more sophisticated layer, typically requiring a platform like Bloomreach, Dynamic Yield, or Klaviyo AI, and meaningful first-party data to train on. Brands without sufficient purchase history or customer data will see limited lift from personalization tools.
Site search is one of the highest-intent touchpoints in ecommerce and one of the areas where AI has quietly delivered consistent results. Shoppers who use search convert at 2 to 3 times the rate of browsers, yet poor search experiences (zero-result pages, irrelevant results, inability to handle natural language queries) have historically driven significant drop-off.
Semantic search, which interprets meaning rather than just matching keywords, has been the primary upgrade. Bloomreach customers have seen up to 8.5% more revenue per visitor with personalized search experiences. At scale, that is a meaningful revenue lever that requires no additional traffic acquisition spend.
Visual search is an emerging adjacent capability. Tools like Bloomreach's visual search allow shoppers to upload a photo and find similar products, which is particularly useful for fashion, home decor, and lifestyle categories where text-based search is inherently limited. This is still an early-stage feature for most retailers, but adoption is accelerating.
For DTC brands evaluating search tools, the practical platforms include Bloomreach, Searchspring, and Constructor.io. Each takes a different approach to balancing AI automation with manual merchandising controls, which matters for smaller teams without dedicated merchandising resources.
AI-powered customer service has become table stakes for most ecommerce brands operating at scale. The operational case is clear: stores using conversational AI report 45% fewer support tickets alongside measurable conversion improvements. The cost reduction math is straightforward when you are handling thousands of support interactions per month.
The conversion story is more nuanced. Research consistently shows chatbots can deliver 20% or higher conversion increases when proactive chat is triggered at the right moment, but the bottom 20% of implementations see no improvement and some decrease conversion by 12%. Deployment quality matters enormously.
The clearest wins are in post-purchase support (order status, returns, tracking), which can be almost fully automated. Pre-purchase consultation is where results vary more. AI agents that accurately answer product-specific questions and make genuine recommendations perform well, while those offering generic responses or escalating too aggressively erode trust.
Platforms like Gorgias AI and Intercom Fin have made meaningful progress on ecommerce-specific training, which narrows the quality gap compared to generic chatbot deployments.
AI-generated ad creative has seen rapid adoption. Nearly 90% of advertisers now use some form of generative AI in their creative workflow, up from approximately 55% at the start of 2025. The efficiency argument is strong: production timelines compress significantly and iteration speed increases.
Performance data is more qualified. Businesses report as much as a 72% lift in ROAS after implementing AI-generated ad strategies, but results are highly dependent on the quality of inputs (product data, brand guidelines, audience signals) and the specific platform. Meta's Advantage+ creative features, paired with its Lattice and Andromeda AI systems, delivered a 22% increase in ROAS for brands using the full suite in late 2025.
One pattern worth noting: AI-generated creative has historically performed best for lower-AOV products. Analysis from early 2026 shows AI creative matching human performance up to a $100 AOV threshold, up from $25 AOV parity in early 2025. For higher-AOV products, human creative direction still outperforms pure AI generation, though AI-assisted workflows (where humans brief and edit AI drafts) are narrowing that gap.
Tools like AdCreative.ai, Madgicx, and Meta's own Advantage+ suite are the most widely adopted. The honest framing: AI creative is a volume and iteration tool, not a replacement for brand strategy and creative direction.
Demand forecasting is an area where AI delivers consistent, measurable operational impact, though it is less visible than the customer-facing applications above. A Gartner study found AI-driven demand planning improves forecast accuracy by 20 to 30% over traditional methods. Brands that have implemented AI forecasting report an 18% decrease in stockouts and a 25 to 40% reduction in supply chain costs.
The constraint is data quality and history depth. AI forecasting models need 12 to 24 months of clean sales data, accurate inventory records, and ideally external signals (seasonality, promotions, social trends) to produce meaningful improvements. Brands with limited data history, inconsistent SKU tracking, or highly seasonal catalogs will see smaller gains.
Shopify's Sidekick, Inventory Planner, and invent.ai are among the practical options for DTC brands. Enterprise platforms like Oracle and Blue Yonder serve larger operations. This use case rewards brands that treat data infrastructure as a strategic asset, not an afterthought.

A few AI ecommerce applications have generated significant attention without delivering proportional results at the brand level. Fully autonomous AI agents managing entire marketing campaigns from budget to creative to audience without human oversight are still highly inconsistent. The underlying models lack sufficient context about brand positioning, competitive dynamics, and customer relationships to operate independently at this stage.
AI-generated product descriptions at scale also face a quality ceiling. Generating thousands of descriptions quickly is genuinely useful for catalog expansion, but undifferentiated AI copy does not contribute to SEO distinctiveness or brand voice. Brands treating it as a full replacement for content strategy are creating quantity without quality.
The pattern across overhyped applications is similar: AI as a complete replacement for strategic judgment does not work yet. AI as an accelerant for human decision-making works consistently.
Given the maturity landscape, brands at the growth stage should sequence investments deliberately. Personalization and AI search are proven at scale with clear benchmarks, making them the highest-ROI, lowest-risk starting points. Customer service AI for post-purchase automation is a strong second investment with fast payback.
Ad creative AI makes sense as a volume and iteration tool once those foundations are in place. Demand forecasting becomes a priority as catalog complexity and inventory carrying costs grow.
See our analysis of ecommerce digital marketing channels for context on where AI tools slot into your broader growth strategy. And if you want to understand the market-level data underpinning AI adoption, the ecommerce statistics we track include updated AI traffic and conversion benchmarks.
The brands seeing the best results from AI in 2026 are not necessarily the ones using the most tools. They are the ones who have identified one or two high-leverage applications, integrated them cleanly into existing workflows, and invested in the data quality that makes AI models perform.
If you are evaluating where AI fits in your ecommerce growth strategy, EmberTribe works with DTC and growth-stage brands to build content and paid media programs grounded in data, not trends. Get in touch to see how we approach it.

If you've ever asked "what is Google AdWords," the short answer is: it's the original name for what is now called Google Ads, the world's largest paid search and digital advertising platform. Google renamed AdWords to Google Ads in July 2018, but the underlying engine, pay-per-click auctions, keyword targeting, and intent-based reach, remained the same. Understanding both names matters because most search traffic still uses "AdWords" as shorthand, even in 2026.
This guide covers everything you need to know: the rebrand history, how the auction works, which campaign types exist today, what it costs, and whether the platform fits your business goals.
Google launched AdWords in October 2000, initially offering 350 advertisers the ability to bid on keywords and show text ads in search results. For nearly two decades, "AdWords" was synonymous with paid search. But by 2018, the platform had expanded well beyond keyword-based text ads to include display banners, shopping listings, YouTube video ads, and app install campaigns.
On June 26, 2018, Google officially announced the AdWords rebrand to Google Ads, alongside a broader restructuring of its entire ads business. DoubleClick advertiser products and Analytics 360 were folded into Google Marketing Platform, while DoubleClick for Publishers became Google Ad Manager. The goal was to simplify a product lineup that had grown into an alphabet soup of overlapping brand names.
The name change did not affect campaign performance, reporting, or ad auction mechanics. If you had existing campaigns running in AdWords, they continued running unchanged under the new Google Ads interface. The rebrand was cosmetic and organizational, not technical.
Today, Google Ads generates over $265 billion in annual revenue for Alphabet, making it the dominant force in digital advertising globally.
Google Ads operates on a real-time auction that runs every time a user submits a search query. Understanding how that auction works is essential for anyone spending money on the platform.
Your ad's position in search results is not determined by bid alone. Google calculates an Ad Rank score for every eligible advertiser, and the highest Ad Rank wins the top spot. According to Google's own documentation, Ad Rank is determined by six primary factors: your bid amount, your ad quality, the Ad Rank thresholds for the auction, the competitiveness of that specific auction, the context of the search (device, location, time of day), and the expected impact of your ad extensions.
Quality Score is a 1-10 rating that reflects three components: expected click-through rate, ad relevance to the keyword, and landing page experience. A higher Quality Score means Google considers your ad more relevant to the user, which can lower your effective cost per click. Critically, Google now classifies Quality Score as a diagnostic tool, not a direct input into the live auction. It signals where your ads stand relative to competitors, but Ad Rank drives actual position.
The auction uses a second-price model. You pay the minimum amount needed to beat the Ad Rank of the advertiser below you, not your full bid. This structure rewards advertisers with high-quality, relevant ads because a strong Quality Score can achieve top placement at a lower cost than a competitor with a high bid but poor ad relevance.
Working with a qualified Google Ads management team can make a measurable difference in Quality Scores, which compounds over time into lower CPCs and better placements.
The platform has expanded significantly since its AdWords days. Here are the five core campaign types available in 2026:
| Campaign Type | Primary Channel | Best For | Funnel Stage |
|---|---|---|---|
| Search | Google Search results | High-intent keyword capture | Bottom |
| Shopping | Search + Shopping tab | Product-based ecommerce sales | Bottom |
| Performance Max | All Google channels | Full-funnel automation, scaling | Full funnel |
| Display | Google Display Network (3M+ sites) | Retargeting, brand awareness | Mid/Top |
| Demand Gen | YouTube, Gmail, Discover | Interest-based demand creation | Top |
Search campaigns remain the most direct route to capturing purchase intent. When someone searches "buy running shoes size 10," a well-structured Search campaign puts your product in front of them at exactly the right moment.
Shopping campaigns display product images, prices, and ratings directly in search results. They're essential for ecommerce brands with product catalogs, as they show before organic results and often generate strong conversion rates at competitive CPCs.
Performance Max (PMax) is Google's AI-driven campaign type that serves ads across Search, Display, YouTube, Gmail, Maps, and Discover from a single campaign. Google's recommended budget allocation for ecommerce puts PMax at 50 to 60% of total spend, with AI-optimized bidding across every placement. PMax works best when fed strong creative assets and clear conversion data.
Display campaigns reach users across more than 3 million websites in the Google Display Network. They work well for retargeting visitors who browsed your site but didn't convert, and for building visual brand awareness at scale.
Demand Gen campaigns replaced Discovery ads in 2023 and run across YouTube (including Shorts), Gmail, and the Google Discover feed. They're built for upper-funnel awareness and are particularly effective for DTC brands introducing new products to cold audiences.
Google now packages its most advanced campaign types into what it calls the "Power Pack": AI Max for Search, Performance Max, and Demand Gen, designed to cover the full customer journey from awareness to conversion.
Google Ads costs vary by industry, competition level, and campaign type. There is no fixed entry price: you set a daily budget and pay when users click (CPC), view a video (CPV), or complete a target action (CPA bidding).
According to 2026 benchmark data from WordStream and other sources, the cross-industry average CPC on Search reached $2.96 in Q1 2026, up 12% from $2.64 in Q1 2025. Industry-level costs vary widely. Legal services average $8.58 per click while ecommerce averages closer to $1.16. The steepest CPCs reflect sectors with high lifetime customer value, such as finance, insurance, and legal.
On the return side, ecommerce brands using Google Ads average a blended ROAS of approximately 3.68:1 across the platform, according to Triple Whale's dataset of 18,000+ brands. Search campaigns specifically average 5.17:1 ROAS, while Performance Max averages 2.57:1. Most sustainable DTC brands target a blended ROAS of 2.5x to 4x depending on category margins, and many premium brands aim for 5:1 or higher.
For context, the minimum effective daily budget to gather meaningful data from a Search campaign starts around $20 to $30 per day, though most growth-stage brands budget significantly more to generate statistically useful conversion data within a reasonable timeframe.
Partnering with a capable PPC company that understands auction mechanics and bidding strategy can compress the learning phase and reduce wasted spend.
Google Ads is most effective for businesses where customer intent is the primary driver of conversions. If your customers search for what you sell before buying, paid search captures that intent with precision that most other channels cannot match.
Google Ads tends to perform especially well for:
Google Ads is less ideal for businesses without measurable conversion events, companies with very low average order values where CPC costs compress margins, or brands whose customers do not search before buying (impulse categories often perform better on Meta or TikTok).
For businesses that want both paid search and broader channel management, working with a full-service SEM marketing agency or a search engine marketing company can help ensure budgets are allocated across channels in a way that maximizes blended return.
The platform's core structure has four levels: Account, Campaign, Ad Group, and Ad. Campaigns hold your settings and budget. Ad Groups contain sets of keywords and the ads triggered by those keywords. Ads are the creatives users see.
A basic Search campaign setup for an ecommerce brand typically includes: a keyword list organized by intent (branded, category, competitor, long-tail), match type settings to control how broadly keywords trigger your ads, negative keywords to filter irrelevant queries, and responsive search ads with multiple headline and description variants that Google automatically tests.
From there, bidding strategy, landing page optimization, and audience layering are the primary levers for improving performance over time.
Understanding Google Ads in theory is one step. Executing profitably at scale requires continuous testing, strong campaign architecture, and the ability to read auction signals and respond quickly.
EmberTribe specializes in Google Ads management for DTC and growth-stage brands, building and managing campaigns that are grounded in data and optimized for actual business outcomes, not just platform metrics. Visit embertribe.com to learn how we approach paid search.

Choosing the wrong search engine marketing company doesn't just cost you agency fees. It costs you months of wasted ad spend, missed revenue, and the time it takes to undo a poorly structured account. The market is crowded with firms that call themselves SEM specialists, but the differences in scope, structure, and accountability are significant.
This guide breaks down what SEM companies actually do, how they differ from one another and from SEO agencies, what pricing looks like in 2026, and the specific questions you should ask before signing a contract.
A search engine marketing company manages paid advertising on search engines, primarily Google Ads and Microsoft Advertising (Bing Ads). The core work includes keyword strategy, campaign architecture, bid management, ad copy, conversion tracking, and ongoing optimization to hit a target return on ad spend (ROAS) or cost per acquisition (CPA).
SEM is distinct from SEO. Where SEO builds organic rankings over months, paid search drives traffic within 24 to 72 hours of campaign launch. The tradeoff: average Google Ads CPC reached $5.26 in 2025, up nearly 13% year-over-year, which makes execution quality more important than ever. A poorly managed account at $10,000 per month in ad spend can burn budget on irrelevant clicks while a well-managed one at the same budget drives profitable customer acquisition.
Beyond Google and Bing, most SEM companies also handle YouTube ads, Google Shopping campaigns, and Performance Max, since these campaigns run through the same Google Ads platform.
Not all SEM firms are the same. Before you start evaluating vendors, it helps to know which type of firm you're looking for.

Pure-play SEM firms specialize exclusively in paid search. They run Google Ads and Microsoft Ads, and that's it. If you already have strong organic traffic and a functioning content strategy, a pure-play firm can be an efficient choice. You're paying for deep specialization, not breadth.
Full paid media agencies extend beyond search into Meta, TikTok, programmatic display, and sometimes connected TV. They're built for brands that want cross-channel coordination, where search data informs social creative and vice versa. If you're a scaling DTC brand running multiple acquisition channels, this structure tends to reduce silos and improve attribution clarity.
Full-service growth agencies combine paid search with SEO, CRO, email, and broader strategy. According to Stackmatix's SEM agency selection guide, the strongest agencies blend SEM with conversion rate optimization and content to sync data across channels. This approach is worth considering when your paid search performance is being limited by landing page quality or organic search gaps, not just bid strategy.
For more on how these agency types compare in scope and structure, see our breakdown of SEM marketing agencies.
Most growth-stage brands need both, but the allocation depends on where you are in your growth trajectory. A common split is roughly 75% of search budget toward SEO and 25% toward SEM, though this shifts significantly based on how competitive your category is organically and how quickly you need to acquire customers.
SEM makes sense as the primary channel when you're launching a new product, entering a new market, or need immediate revenue while organic rankings build. SEO makes more sense as a long-term foundation because organic customer acquisition cost is approximately 65% lower than paid search CAC once it matures.
If your question is how to find a quality SEO-focused firm alongside your paid search work, our guide to PPC companies covers the paid side, and we've also written on how to evaluate a best SEO agency for the organic side.
Understanding how SEM companies charge is critical for evaluating bids and avoiding misaligned incentives.
Percentage of ad spend is the most common model. Agencies typically charge 10% to 20% of your monthly ad spend. This works well when your budget is scaling, since the agency's fee grows with your investment. The risk is that it can create an incentive to spend more rather than spend efficiently.
Fixed monthly retainer gives you predictable costs regardless of ad spend volume. Retainers typically range from $2,500 to $10,000 per month for mid-market brands. This model works best when your budget is stable and you want clear deliverables per billing period.
Performance-based pricing ties a portion of fees to specific outcomes: leads generated, revenue driven, or ROAS targets hit. This can align incentives well, but only if the performance metrics are defined precisely and attributed accurately. Vague performance clauses are a red flag.
Hourly consulting ranges from $100 to $300 per hour and is most appropriate when you have an in-house paid search team that needs strategic guidance rather than full execution.
For small businesses, total monthly spend including ad budget and management fees typically lands between $2,000 and $8,000. For mid-market and enterprise brands, expect $15,000 to $50,000 or more per month depending on account complexity.
For context on how Google Ads management is priced and structured separately from full SEM retainers, that post covers platform-specific considerations in more detail.
The market for SEM services is noisy. These are the criteria that actually separate strong firms from expensive ones.
Proven results in your category. Ask for case studies with specific metrics: ROAS improvement, CPA reduction, revenue growth attributed to paid search. Generic claims about "increased traffic" are not a useful signal. Concrete numbers tied to accounts similar to yours in size and industry are.
Account ownership clarity. Some agencies retain ownership of your Google Ads account when you leave. Make sure your contract specifies that you own the account, the data, and the conversion history. Losing account history when you switch agencies can cost months of optimization data.
Conversion tracking rigor. A surprising number of SEM firms inherit broken conversion tracking and either don't notice or don't fix it. Before any strategy conversation, a competent firm should audit your existing tracking setup and identify gaps. If they skip this step, that's a meaningful signal about how they'll manage your account.
Transparent reporting. Ask what reporting cadence they use, what metrics appear in every report, and whether you'll have direct dashboard access. Agencies that only share curated PDFs once a month make it difficult to verify what's actually happening in your account.
Strategic integration. Ask how their paid search work connects to your landing pages. Sending high-intent traffic to a weak landing page is one of the most common ways ad spend gets wasted. A strong SEM firm either handles CRO recommendations directly or works closely with whoever does.
Before you sign with any search engine marketing company, get clear answers to these:
These questions won't guarantee a good outcome, but they will quickly filter out firms that are operating with outdated practices, limited transparency, or insufficient specialization.
A well-run SEM engagement typically follows a predictable ramp. The first 30 days should cover account audit, conversion tracking verification, keyword research, campaign architecture, and initial ad copy. Days 30 to 60 are usually the learning phase for automated bidding strategies, where Google's algorithm gathers conversion data. Days 60 to 90 are when meaningful optimization decisions should start based on real performance data.
If an agency promises dramatic ROAS improvements in the first two weeks, be skeptical. Smart Bidding requires statistical volume to perform well, and aggressive changes in the first month often reset the learning phase unnecessarily.
The right search engine marketing company for your brand depends on where paid search sits in your overall growth strategy. A pure-play SEM firm makes sense if you need deep specialization in a mature account. A full-service agency makes sense if your paid search performance is limited by factors outside the ad account itself, like weak landing pages, poor creative, or organic gaps that are driving up CPCs.
EmberTribe works with DTC and growth-stage brands to build paid search programs that are efficient, transparent, and built to scale. If you're evaluating your current SEM setup or looking for a new partner, get in touch with our team at embertribe.com to walk through what an engagement looks like.

Hiring the right search engine marketing firm is a different decision from hiring an agency. The distinction is not just terminology. Firms typically operate with a consulting-led model, meaning senior practitioners handle accounts directly rather than delegating execution to junior staff. For growth-stage and DTC brands running five- to six-figure monthly ad budgets, that difference in structure can determine whether paid search becomes a scalable acquisition channel or an expensive monthly bill.
This guide breaks down how to evaluate and select an SEM firm in 2026, including how firms differ from agencies and in-house teams, what engagement structures and pricing to expect, and the specific questions that separate strategic partners from volume shops.
The word "firm" carries a specific connotation in professional services. A law firm, a consulting firm, an accounting firm: these are practices built around senior expertise applied directly to client engagements. An SEM firm operates on the same principle.
Where a traditional SEM agency may assign an account manager who oversees a portfolio of 30 clients and hands execution to junior analysts, a paid search firm typically keeps strategic and tactical work at the senior level. The strategist who presents your quarterly roadmap is also the one pulling optimization levers day to day. This structure tends to produce better results for accounts that require nuanced decision-making, such as brands with complex product catalogs, thin margin windows, or competitive ROAS targets.
The Google Ads platform has also grown significantly more complex since the broad rollout of AI-powered campaign types. Performance Max, demand gen, and smart bidding require someone who understands how to structure campaigns to feed the algorithm correctly, not just monitor dashboards. A firm model ensures that judgment stays with experienced practitioners.
The right structure depends on your budget, your internal marketing capacity, and how much strategic depth you need.

The comparison above highlights the structural differences. SEM firms occupy a specific middle ground: more strategic depth than most agencies, more external perspective than an in-house hire, and faster to activate than building an internal function.
In-house teams carry one major advantage that neither firms nor agencies can fully replicate: institutional knowledge. An in-house specialist understands your product margins, seasonality, and customer segments without onboarding. The tradeoff is cost and coverage. A single mid-level paid search hire costs $80,000 to $140,000 per year in salary alone, before tools, benefits, and management overhead.
One person also cannot cover Google Search, Shopping, Performance Max, Microsoft Advertising, and Amazon Ads with equal depth simultaneously.
SEM agencies at the larger end often serve enterprise accounts across dozens of verticals. Their resources are broad, but account attention tends to be distributed. A search engine marketing company operating at scale may rotate your account between analysts as team composition changes, breaking the continuity that good optimization requires.
A boutique SEM firm hits the right balance for most growth-stage brands: dedicated senior attention, multi-platform expertise, and a consulting engagement model that makes strategic alignment part of the recurring workflow rather than an annual QBR.
SEM firm pricing generally follows one of three models, and the structure you agree to shapes the incentives on both sides.
Retainer-based pricing is the most common. According to Swydo's 2026 agency pricing analysis, nearly 80% of agencies now use some form of retainer, providing predictable costs and continuous optimization cycles. For SEM firms specifically, monthly retainers typically range from $3,000 to $12,000 for growth-stage accounts, with enterprise engagements running higher.
Percentage-of-spend models tie the firm's fee to a percentage of your monthly media budget, typically 10% to 20%. This model aligns the firm's revenue with your investment level, but it can create a subtle incentive to increase spend rather than improve efficiency. If a firm operating on this model recommends scaling budget, ask them to show the supporting data before agreeing.
Hybrid structures combine a base retainer with a performance bonus tied to specific KPIs, typically ROAS or CPA targets. InfluenceFlow's 2026 agency pricing guide notes that hybrid models are gaining traction specifically because they align incentives across both parties. The base fee covers core management; the bonus rewards results that exceed targets.
Most reputable SEM firms require a minimum engagement of three to six months. Paid search optimization takes time: account history accumulates, Smart Bidding algorithms need conversion data to stabilize, and creative testing requires statistically significant sample sizes. Any firm offering month-to-month contracts with no minimum is likely managing accounts reactively rather than strategically.
The quality of a firm's answers to these questions reveals more than any case study.
Who will manage my account day to day, and what is their experience level? Ask for the specific person, not a team description. Understand their seniority, how many accounts they manage simultaneously, and whether they will be your primary point of contact or whether an account manager will be in that role.
How do you approach account structure for a brand at my spend level? A strong answer involves campaign architecture decisions specific to your goals, such as how they would allocate budget across campaign types, whether they would use Performance Max or campaign-by-campaign structures, and how they handle brand vs. non-brand separation.
What does your reporting cover, and how do you connect it to revenue? As Gartner's Digital IQ research on search marketing benchmarks notes, firms that report activity without connecting to financial outcomes are showing effort, not results. Demand reports that include ROAS, CPA, and contribution to pipeline or revenue, not just impressions and clicks.
Can you walk me through a campaign you restructured and what the outcome was? This question separates firms that execute from firms that think. A firm worth hiring can describe the specific reasoning behind a structural change, not just point to a before-and-after screenshot.
What platforms do you actively manage, and do you have certifications? In 2026, a capable SEM firm should be active across Google Ads, Microsoft Advertising, and ideally have experience with Google Shopping and Performance Max. Google's official certification program is a baseline indicator, not a differentiator on its own, but the absence of active certifications is a flag.
Some agencies adopt firm-style language without firm-style operations. Watch for these warning signs.
A discovery process that lasts less than one week before campaign launch means the firm is not building strategy from your data. Effective onboarding includes access to historical account data, a review of existing creative and landing page performance, audience definition, and goal alignment before a single campaign goes live.
Reporting focused on vanity metrics such as impressions, clicks, and quality scores without revenue correlation is a sign the firm is optimizing for what looks good in a deck rather than what drives your business. Ask to see a sample report before signing.
Contracts with aggressive auto-renewal clauses or vague scope definitions should trigger a legal review. Reputable SEM firms define deliverables clearly, including reporting cadence, meeting frequency, response time commitments, and what happens if performance benchmarks are not met.
Account access held by the agency rather than the client is non-negotiable. Your Google Ads account, your data, and your conversion history belong to you. Any firm that cannot give you full admin access to your own account at any point in the engagement should be disqualified immediately.
The first 90 days of an SEM firm engagement establish the baseline. Expect the following milestones as indicators that the engagement is on track.
By the end of week two, conversion tracking should be verified and firing correctly across all campaigns. By the end of month one, campaign architecture should be finalized and initial bid strategies set based on your historical data. By the end of month three, performance should be trending toward your ROAS or CPA targets, with creative tests in progress and an optimization log documenting what changes were made and why.
If a firm cannot show you a detailed optimization log by the end of month two, ask directly what work was performed and when. Firms that operate strategically document their decisions. Shops that execute mechanically do not.
If your SEM program also needs to integrate with organic search efforts, it is worth reviewing how a search engine marketing services model coordinates paid and SEO channels. The two strategies share keyword data, landing page infrastructure, and conversion rate insights. Firms that can inform both sides of search tend to produce better overall results than those narrowly focused on paid alone.
EmberTribe works with DTC and growth-stage brands that need senior-level paid search strategy without the overhead of building an in-house function. Our engagements are structured around direct access to experienced practitioners, transparent reporting tied to revenue outcomes, and clear accountability at every stage of the funnel.
If you are evaluating SEM firms and want to understand what a strategy-first engagement looks like for your account, visit embertribe.com to start the conversation.
The distinction that separates high-performing retail brands from the rest is not how many channels they operate. It is whether those channels share a single view of inventory, customer data, and purchase history. That distinction is the difference between multichannel and omnichannel commerce, and the performance gap between them is large enough that every growth-stage brand building a channel strategy needs to understand it clearly.
Omnichannel commerce means a customer's cart, purchase history, support interactions, and preferences follow them across every touchpoint. A study of 46,000 shoppers by Harvard Business Review found that 73% of buyers use multiple channels during a single shopping journey, and that customers who engaged across four or more channels spent 9% more in-store than single-channel shoppers and logged 23% more repeat visits within six months of an omnichannel experience. The compounding effect on retention and lifetime value is why Manhattan Associates' 2025 Omnichannel Trends research shows only 17% of retailers have mature capabilities despite 54% listing it as their top strategic priority.
The vocabulary matters because confusing these terms leads to misallocated investment.
Multichannel means selling across multiple independent channels: a website, Amazon, retail stores, social commerce. Each channel operates with its own inventory count, its own customer data, and its own messaging. A brand can be present on six channels and still be multichannel. The internal question for multichannel is: how do we get the most out of each channel independently?
Omnichannel connects those channels into a coordinated customer experience. The customer's identity and behavior history follow them across touchpoints. A buyer who browses on mobile, adds to cart on desktop, and purchases in-store is recognized as the same customer across the journey. The internal question shifts to: how do we give each customer the best experience regardless of where they engage?
Unified commerce is where omnichannel is heading in 2025 and 2026. The distinction, articulated by Sitoo's unified commerce research, is in the architecture. Omnichannel often connects existing siloed systems via APIs and middleware. Unified commerce runs all channels from a single backend: one order management system, one inventory ledger, one customer record, no integration layer to maintain.
Brands with unified commerce report 27% lower fulfillment costs and 18% reduced cart abandonment, per Manhattan Associates data.
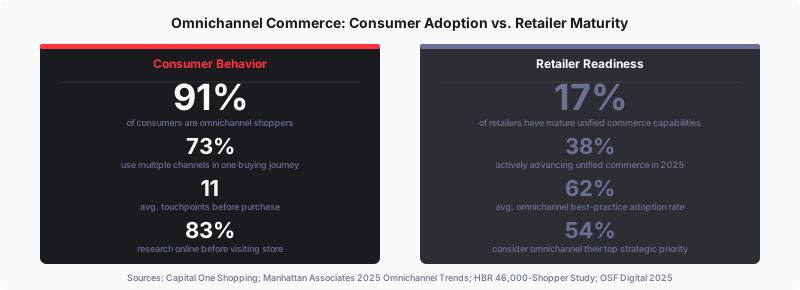
The numbers from Capital One Shopping's omnichannel statistics research show the magnitude of what is at stake. Companies with strong omnichannel engagement retain 89% of customers, compared to 33% for brands with weak omnichannel strategy. Omnichannel customers spend 16% more per order and purchase 250% more frequently. Their lifetime value is 30% higher.
The HBR finding that 73% of shoppers use multiple channels in a single journey, combined with 91% of consumers qualifying as omnichannel shoppers, means the question for most brands is not whether to pursue omnichannel. It is how far behind they currently are and what the cost of that gap is in retention, LTV, and competitive position.
The market is moving. Capital One Shopping's omnichannel research reports that curbside pickup increased conversion rates by 25.8% in 2024 among the top 1,000 retailers. Real-time inventory visibility online drives significant cart completion improvements when customers can see whether a product is available at a nearby location.
The infrastructure investment is what separates a genuine omnichannel program from channel coordination with good marketing. The core components:
The brands executing omnichannel at scale demonstrate the revenue impact concretely. Warby Parker started as a direct-to-consumer online brand and now operates 276 or more stores generating 70% of total revenue. Full year 2024 revenue reached $771.3 million with 15.2% year-over-year growth, per Warby Parker's Q4 2024 results.
Physical stores did not cannibalize digital. They amplified total customer acquisition and LTV by bringing try-on and optometry into the physical world while keeping digital as the discovery and repurchase layer.
Starbucks runs 70% of US sales through mobile and drive-thru orders. Its 31 million active loyalty members generate over 50% of US revenue and spend three times more than non-members. The deep brew AI system personalizes recommendations across the app, drive-thru, and in-store touchpoints from a single customer data record.
Sephora has unified online and offline customer profiles since 2010. The Color IQ tool links in-store skin tone scans to customer profiles and surfaces personalized online product recommendations in subsequent digital sessions. That single data integration turns a physical in-store moment into a durable digital personalization signal.
Most omnichannel failures trace to a small set of structural problems that brands underestimate before launch.
The 91% consumer omnichannel adoption rate versus 17% retailer maturity rate defines a competitive landscape where the gap between infrastructure leaders and laggards is widening. The brands getting this right are demonstrating the results: 89% customer retention, 250% purchase frequency lift, 30% LTV premium. The brands behind the curve are funding customer acquisition into a leaky retention system.
For growth-stage DTC and ecommerce brands evaluating their channel infrastructure and cross-channel marketing strategy, EmberTribe works with brands on the demand generation and channel investment decisions that determine whether omnichannel infrastructure pays off or underperforms.

Paid social media advertising is a $227.95 billion global market in 2026, up from $202.63 billion in 2025, according to eMarketer's global social ad forecast. At that scale, the category includes agencies ranging from single-channel Meta specialists to multi-platform shops running creative production alongside media buying. Choosing a paid social media agency without understanding what separates these models costs most brands 60 to 90 days of wasted spend and a failed relationship before they make a better choice.
This guide covers platform benchmarks, creative evaluation criteria, pricing structures, and the specific signals that separate competent paid social agencies from ones that know how to win pitches.
The paid social landscape has fragmented significantly over the past three years. Meta, TikTok, Pinterest, LinkedIn, and YouTube each operate on distinct auction mechanics, content formats, and audience signals. An agency that runs all five with the same framework is running none of them well.
Meta remains the dominant paid social platform for DTC and ecommerce brands. Meta CPM averaged $16.80 in 2025, up 18.3% year-over-year, per Trendtrack's social advertising benchmarks. The median ROAS across 20,000-plus DTC brands tracked by Triple Whale is 1.93x.
Meta's Andromeda algorithm update has fundamentally changed how the platform distributes ads: where audience signals once drove distribution, creative signals now dominate. An agency that has not updated its Meta strategy post-Andromeda is running a 2022 playbook.
TikTok offers a different economic profile: CPM averaging $8.30 globally, with TikTok-reported ROAS of 2.21x for commerce-focused campaigns. The lower CPM creates more efficient reach, but TikTok demands a specific creative format. User-generated content outperforms brand-produced creative by two to three times on the platform, per Motion's creative benchmarking data. Agencies that run TikTok with polished brand creative consistently underperform agencies that produce native-style UGC content.
Creative is the single most important variable in paid social performance. Google's internal research, widely cited across the industry, attributes 70% of campaign success to creative quality rather than targeting or bidding. Meta's own platform data confirms that creative signals have replaced audience signals as the primary distribution driver.
This means evaluating a paid social media agency primarily on its creative process, not its media buying sophistication. The media buying side has been largely automated: Smart Bidding, Advantage+, and algorithmic audience optimization have compressed the performance differential between buyers. The creative production side has not been automated. The agency that generates more creative variants, tests them systematically, and scales winners faster wins.
Specific creative questions to ask before hiring: How many ad variants do you launch in the first 30 days? What is your creative iteration frequency? Do you produce creative in-house or through a third party? What is your process for identifying creative fatigue and rotating assets? Agencies that cannot answer these questions in specific, measurable terms are not operating a creative testing system.

The benchmark gap between Meta and TikTok CPMs creates a common misconception: that TikTok is automatically more efficient. Efficiency depends on whether your audience is on the platform and whether your creative converts in TikTok's native format. A brand with a 45-plus core demographic and a catalog-based product will underperform TikTok CPM benchmarks because the audience-product fit is wrong, not because the agency is failing.
LinkedIn's CPM of $33.80 to $45.00 looks expensive relative to Meta, but for B2B brands targeting specific job functions, company sizes, or industries, LinkedIn's targeting precision reduces wasted impressions in ways that justify the CPM premium. A paid social agency that runs both DTC and B2B accounts has likely accepted that it will underperform specialists in both categories.
Paid social agencies use two primary pricing models: percentage of ad spend and flat monthly retainer, with hybrid approaches becoming more common at the growth stage.
Percentage of spend (10 to 20% of monthly media budget) is the most common structure for accounts spending between $10,000 and $100,000 per month. The incentive misalignment risk is that the agency benefits financially from increasing your budget regardless of performance. Flat retainers ($3,000 to $10,000 per month for growth-stage brands) align incentives toward quality because the fee does not change with spend. Hybrid models typically include a flat management fee plus a smaller performance percentage tied to specific ROAS or CPA targets.
For brands evaluating whether to hire a specialist or a full-service digital marketing firm, the decision depends on channel complexity. If paid social is the primary acquisition channel and creative iteration speed matters, a specialist outperforms a generalist. If you need paid social to integrate closely with paid search and email attribution, a broader firm with coordinated reporting infrastructure may deliver better outcomes even if per-channel performance is slightly weaker.
The most predictive evaluation of a paid social agency is reviewing its existing creative output, not its pitch deck or case study performance metrics. Ask for examples of creative work produced in the last 60 days for a brand in your category. Evaluate: Is the creative thumb-stopping in the first two seconds? Does it communicate the offer within the first three seconds without requiring sound? Does the creative match the native aesthetic of the platform it was produced for?
Agencies that show you polished brand video as their primary paid social creative have not adapted to the UGC-first creative environment on TikTok and Reels. The best paid social agencies for ecommerce produce creative that looks indistinguishable from organic content because that is what performs.
Ask also about creative volume: how many net new creative variants are produced per month for a typical account at your spend level? Fewer than 8 to 10 new variants per month at $20,000 or more in monthly spend suggests creative testing is not a core part of the engagement.
Several patterns consistently appear in failing paid social relationships and are visible before signing a contract.
Agencies that lead with audience strategy and targeting segmentation are describing 2021 Meta. Platform algorithms now outperform manual audience segmentation for most objectives. An agency whose pitch centers on custom audience layering and lookalike structures is not operating a creative-first system.
Reporting that shows ROAS without clarifying attribution window is meaningless. A 7-day click, 1-day view attribution window tells a very different story than a 1-day click, 0-day view window. Agencies that report ROAS without specifying the attribution model are presenting the most favorable number rather than the most accurate one.
Monthly retainer agreements with 12-month lock-ins and no performance exit clause protect the agency, not the client. Strong agencies do not need 12-month contracts. If early exit requires penalty payments rather than 30-day notice, that clause exists because the agency expects underperformance complaints.
For growth-stage ecommerce and DTC brands building paid social alongside content and search programs, EmberTribe works on the demand generation infrastructure that reduces paid CAC by creating organic discovery alongside paid acquisition.

Unified commerce is not a marketing term for an upgraded omnichannel strategy. It is a fundamentally different architectural decision: instead of connecting separate systems after the fact, unified commerce runs all channels from a single backend data layer that handles orders, inventory, customers, pricing, and loyalty in real time.
The distinction matters because the problem omnichannel was designed to solve, that customers experience friction when moving between channels, cannot be fully solved at the experience layer. The friction originates in the backend.
Omnichannel is a frontend experience strategy. The goal is to make the customer journey feel consistent across touchpoints: the same promotions online and in-store, the ability to return online purchases at physical locations, buy-online-pick-up-in-store functionality. That is valuable. It is also structurally limited.
The problem: achieving consistent experience across channels requires that separate, siloed systems stay in sync. The ecommerce platform, POS, inventory management, OMS, CRM, and loyalty program all communicate through API integrations and middleware. Every sync is a potential failure point, and every integration introduces latency.
Because each system holds its own version of truth, inventory counts, customer records, and order status can diverge in ways that only surface at checkout or fulfillment.

Unified commerce eliminates the sync problem by eliminating the silos. Every channel reads from and writes to the same data layer. When a customer buys in-store, inventory updates everywhere immediately, and when a loyalty point is earned online, it is visible at the register in real time.
There is no reconciliation because there is nothing to reconcile.
The practical consequence: omnichannel can tell a customer that an item is available for pickup. Unified commerce can guarantee it, because the inventory count is the same number the checkout system read half a second ago.
Despite being a recognized priority for years, unified commerce remains rare in practice. According to Manhattan Associates' Unified Commerce Benchmark, only approximately 7% of retailers have achieved true unified commerce maturity.
The gap between intent and execution is not primarily a technology problem. It is an organizational and migration problem.
Most retailers built their ecommerce operations by layering digital channels onto existing physical retail infrastructure. Each channel acquired its own system over time: the POS came first, the ecommerce platform was added later, the inventory management system predates both, and the loyalty program was bolted on after a rebrand.
Each system carries years of transaction history, customer records, and customizations built specifically for it. Replacing or consolidating them is a multi-year project with no clean phasing.
The specific challenges that block most implementations:
Data migration complexity. Consolidating customer records across systems that used different identifiers, address formats, and loyalty structures requires significant data modeling before a single line of migration code is written.
Organizational resistance. Different channels often have separate P&L owners. The ecommerce team and the retail operations team may not report to the same executive. Infrastructure decisions that require both to change their systems simultaneously run into jurisdictional friction that no vendor can resolve.
Platform misrepresentation. Not all platforms marketed as "unified" are architecturally unified. Some are middleware layers that create the appearance of a unified backend through faster syncing. The distinction requires examining the actual data model, not the marketing language.
The business case for the investment is strong in verified implementations. Manhattan Associates' Unified Commerce Benchmark documents consistent results across retailers that have completed the transition.
Fulfillment cost reductions of 27 to 31% emerge from real-time inventory visibility across all locations. When the order management system knows exactly what is in every store and warehouse simultaneously, it routes fulfillment to the cheapest and fastest origin rather than defaulting to the distribution center for every order.
Cart abandonment rates run 18 to 20% lower compared to omnichannel implementations. The friction that drives abandonment, inaccurate inventory displays, inconsistent pricing, and failed cross-channel promotions, is structurally eliminated rather than patched.
Average order value and customer lifetime value improve 11 to 14%. Customers who shop without friction spend more per transaction and return more often. Loyalty program engagement improves when points are visible and usable across every channel without manual reconciliation.
These outcomes are not immediate. The ROI from unified commerce is backend-heavy: the infrastructure investment comes first, the revenue impact follows over 12 to 24 months as the customer experience compounds. Planning the business case around short-term payback periods understates the actual return.
The platform market has matured significantly. Three architectures dominate serious implementations.
Shopify Plus is the most accessible path for mid-market DTC brands. Shopify's native POS integration, combined with its unified order management and inventory layers, delivers genuine backend consolidation for brands operating a manageable number of store locations. Shopify's headless capabilities allow custom frontends without fragmenting the backend data model. The ceiling on customization is lower than composable alternatives, and brands with complex B2B or wholesale pricing structures often reach it.
Commercetools is the leading composable commerce platform for enterprise retailers that need full architectural flexibility. It is API-first and component-based: retailers assemble best-of-breed services connected to a unified commerce layer rather than buying a single-vendor platform. Implementation complexity and cost are significantly higher, but the ceiling for customization reflects that complexity. Enterprise brands with multi-region operations, complex pricing rules, and unique fulfillment models are the natural fit.
Salesforce Commerce Cloud sits between the two in implementation complexity and cost. It suits brands already operating in the Salesforce ecosystem (Service Cloud, Marketing Cloud, CRM) where native data sharing across those systems reduces integration work. The advantage is that customer data flows between commerce, service, and marketing without separate integrations. The trade-off is platform lock-in and licensing costs that are harder to justify below a certain revenue threshold.
Platform selection should be driven by three variables: the current tech stack and what stays versus gets replaced, the number and complexity of channels being unified, and the internal engineering capacity to manage implementation and ongoing maintenance.
Organizations that succeed at unified commerce follow a phased approach that avoids the big-bang migration failure mode.
The phasing matters because each layer depends on the one below it. Building loyalty programs on top of fragmented customer data produces poor results regardless of the platform. Optimizing fulfillment routing without real-time inventory produces more errors than it resolves.
Unified commerce is not the right infrastructure decision for every brand at every stage. For brands operating one or two channels with manageable complexity, the coordination overhead of a unified backend may not justify the cost. Well-run omnichannel integrations remain a viable path.
For ecommerce brands operating four or more channels with significant cross-channel customer behavior, the math shifts. The compounding cost of maintaining API integrations, reconciling inventory discrepancies, and patching friction in cross-channel journeys eventually exceeds the cost of architectural consolidation. The question becomes not whether to consolidate, but when the business has the operational capacity to execute it correctly.
If you are evaluating whether unified commerce is the right next infrastructure investment for your brand, EmberTribe works with growth-stage DTC and B2B retailers on the strategy and implementation planning for commerce infrastructure decisions that affect acquisition, retention, and fulfillment economics.
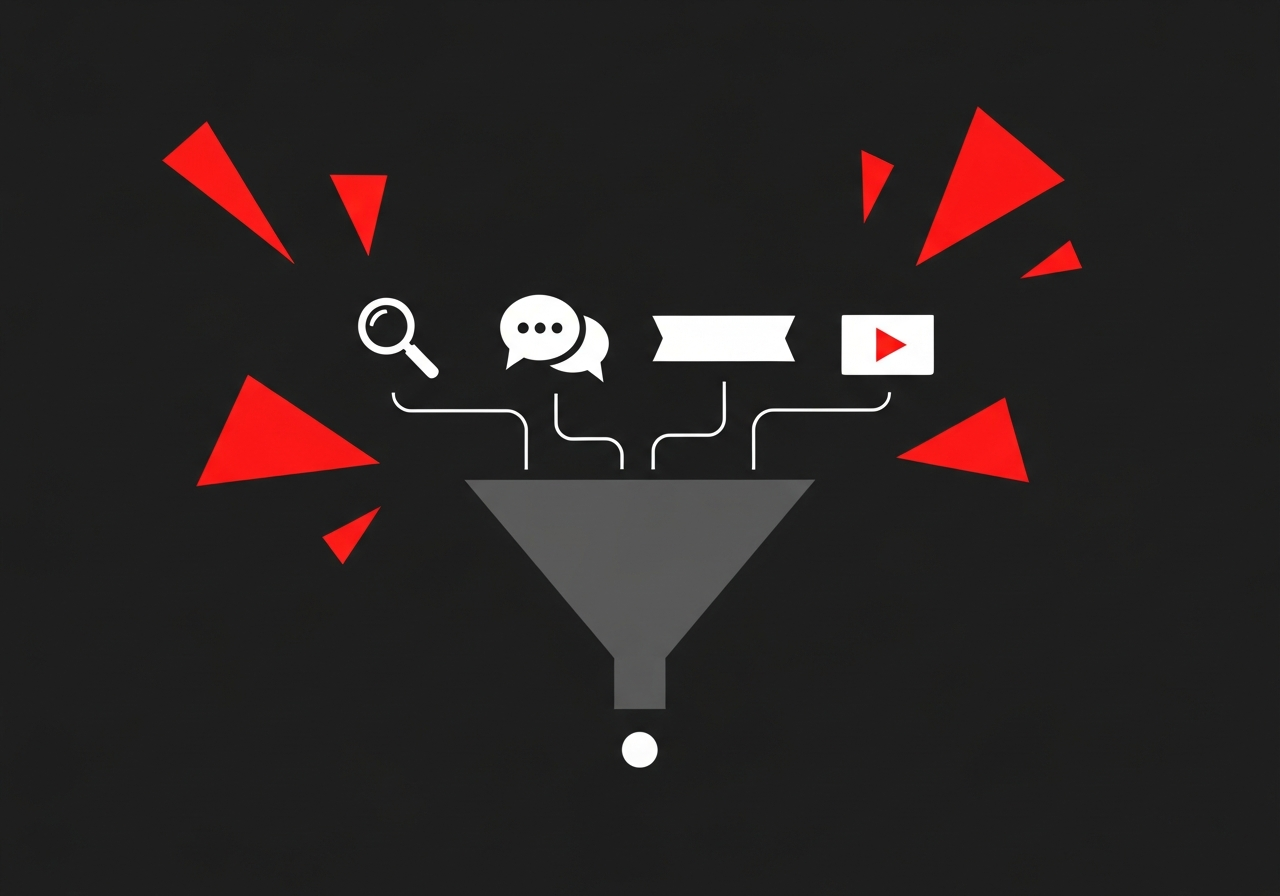
Most companies that hire for paid media services think they are buying campaign management. What they are actually buying, or should be buying, is a system: channel strategy, creative infrastructure, attribution setup, and reporting tied to business outcomes. The difference between those two things is the difference between an agency that manages traffic and one that manages growth.
Pay-per-click (PPC) management is a subset of paid media. Historically, PPC meant Google Search and Bing Ads: keyword lists, match types, Quality Scores, bidding. Paid media is the broader discipline.
A complete paid media program spans:
A PPC manager optimizes within a platform. A paid media strategist manages channel mix, cross-channel budget allocation, full-funnel messaging sequencing, and unified attribution across all of them. If your current engagement only touches one or two platforms, you have PPC management, not paid media services.
Understanding scope prevents the most common agency misalignment: discovering that "creative included" means templates, or that the monthly report shows clicks but not revenue.
The service components that should be clearly defined before any retainer is signed:
Strategy and channel selection. Audience research, funnel mapping, budget modeling across channels, competitive landscape analysis, and offer and angle development per funnel stage. This work happens before any campaign launches and should produce a written brief, not just a channel checklist.
Creative services. Ad concepting, copy, production (or direction of production), creative testing frameworks, and refresh cadence to fight ad fatigue. Many agencies separate creative production fees from management fees without surfacing this in the proposal. Ask specifically: how many static ads per month, is video included, how many revision rounds, who owns final assets if the relationship ends.
Media buying and campaign management. Account architecture, pixel and tag implementation, audience segmentation (prospecting versus retargeting), bid strategy, budget pacing, negative keyword management for search, and placement exclusions for programmatic. The ongoing component includes A/B testing of creatives, audiences, and landing pages on a documented cadence.
Every paid channel serves a different role in the buying journey. Running channels without mapping them to funnel stages results in either over-investing in awareness when the conversion bottleneck is at the bottom, or under-investing in demand generation when the issue is not enough people entering the funnel at all.

The most expensive mistake is treating all paid channels as interchangeable. Meta Ads at the awareness stage requires different creative, different success metrics, and different optimization logic than branded Google Search at the bottom. An agency that runs the same optimization playbook across all channels is not running a paid media program.
Retail media has become the highest-growth segment of paid advertising and one of the most under-utilized by growth-stage DTC brands. US retail media ad spend reached $60.32 billion in 2025 and is growing 17.8% year-over-year, outpacing both social and search, according to retail media network analysis from Improvado.
Amazon holds 79.7% of US retail media share. Amazon Ads (Sponsored Products, Sponsored Brands, Sponsored Display) are effectively a requirement for brands selling on Amazon, because not advertising means ceding shelf position to competitors who are.
How to think about retail media budget: it is closer to trade spend than brand or performance budget. It should not compete with DTC acquisition spend. Start with defensive campaigns protecting your own product pages from competitor conquesting. Once that is covered, test conquest and category awareness campaigns.
The attribution challenge with retail media is significant. Retail media platforms over-attribute: they report all sales where an ad was shown, not only the incremental sales driven by the ad. Run holdout tests or use third-party attribution tools to find true incremental ROAS before scaling investment.
Scope varies substantially by retainer size. Knowing what is reasonable at your budget prevents signing a contract that is under-resourced for your actual goals.
$5,000 to $10,000 per month: One to two channel management (typically Meta plus Google, or Google plus LinkedIn for B2B), monthly creative consultation (not production), conversion tracking setup, monthly performance report with a strategy call, and basic audience segmentation. Landing page CRO and advanced attribution are generally separate at this tier.
$10,000 to $30,000 per month: Full multi-channel management, creative strategy and light production or direction, weekly reporting with biweekly strategy calls, an A/B testing program, attribution consultation including pixel setup and data hygiene, first-party data integration (customer match, lookalikes), and competitive analysis. Fee structure is typically a flat retainer of $8,000 to $15,000 or 12 to 18% of managed ad spend.
$30,000 or more per month: Full-stack management across all channels, a dedicated creative team or embedded creative director, custom reporting dashboards and data warehouse integrations, an incrementality testing program, retail media management, and programmatic via a DSP. Fee structure compresses to 8 to 12% of spend at this scale. Quarterly strategy reviews with senior involvement should be standard.
Before signing at any tier, confirm four things: whether creative production is included or billed separately, who pays platform and tool software fees, the minimum contract length and exit terms, and who owns all ad accounts and assets if the relationship ends.
Post-iOS 14.5 privacy changes broke pixel-based attribution for Meta and most social platforms. By 2025, last-click attribution in GA4 dramatically over-credits search and under-credits social and upper-funnel channels. Meta's in-platform reported ROAS is often inflated by 30 to 50% due to modeled conversions.
This creates a predictable failure mode: a brand cuts Meta spend because in-platform ROAS looks weak, then sees revenue drop without an obvious cause. This pattern is documented repeatedly by Adjust's analysis on attribution and incrementality: the real issue is measurement, not performance.
Three methodologies handle this correctly:
Incrementality testing divides audiences into exposed and control groups by geography and measures actual lift versus what would have happened without the ad. This is the gold standard for channel-level budget decisions. Tools that run these tests include Meta's Conversion Lift, Measured, Haus, and Triple Whale.
Marketing Mix Modeling (MMM) correlates marketing spend by channel with revenue over time, controlling for seasonality and external factors. Open-source tools Meridian (Google) and Robyn (Meta) have made MMM accessible to brands that could not previously afford it.
Marketing Efficiency Ratio (MER), the ratio of total revenue to total ad spend, serves as a blended north star metric that cuts through cross-channel attribution debates. It does not tell you which channel drove what, but it tells you whether total paid media is profitable.
A paid media agency at any serious budget level should have a clear answer for how they handle attribution post-iOS 14. If the answer is "we report what the platforms say," that is not good enough.
Agency-owned ad accounts. If the agency runs campaigns inside their own Business Manager rather than granting partner access to your account, you own nothing when the relationship ends. Campaign history, audiences, pixel data, and conversion history all disappear. Require account ownership language in the contract.
Vague creative clauses. "Creative support included" with no specifics on format, volume, or revision rounds is a scope ambiguity that reliably creates billing disputes. Require explicit deliverables: number of static ads per month, video yes or no, revision rounds, and asset ownership at termination.
Traffic-only reporting. Reports showing impressions, clicks, CTR, and CPM with no conversion data, no ROAS, and no cost per acquisition. This is a measurement failure dressed as a reporting cadence. Revenue attribution is not optional.
For a closer look at how these standards apply specifically to PPC advertising companies, the evaluation criteria are consistent. The scope just narrows to search and shopping campaigns rather than the full paid media mix.
Global digital ad spending surpassed $750 billion in 2025, representing more than 75% of worldwide total media spend, according to Statista's digital advertising market data. That scale means the stakes of paid media decisions have compounded. A well-structured program with clean attribution and disciplined channel allocation performs very differently from one that is technically running but flying blind on what is actually working.
The companies that get the most from paid media services are not the ones that found the best individual channel. They are the ones that built a coherent program: funnel-mapped channels, real attribution, creative that is systematically tested, and an agency relationship accountable to business outcomes from day one.
If you want to build that kind of program, EmberTribe works with growth-stage DTC and B2B brands on paid media strategy connected to revenue, not activity reports.
PPC companies manage a growing share of business advertising spend, but the category covers four structurally different types of vendors with different specializations, pricing models, and ideal client profiles. Choosing the wrong type for your business model is one of the most common and costly mistakes in paid media. Understanding how PPC companies are structured, how they price, and how to measure whether they are performing gives you the framework to make a defensible hiring decision.
The PPC industry is not homogeneous. Each structural type serves a different acquisition problem, and the evaluation criteria differ significantly across them.
Pure search specialists focus exclusively on Google Ads and Microsoft Ads. They develop deep expertise in campaign structure, match type strategy, Quality Score optimization, and bidding automation. The median Google Ads ROAS across search campaigns is 3.31x, with average cost-per-acquisition running $48.96 for search, per AgencyAnalytics' 2025 PPC benchmarks. Pure search specialists consistently outperform generalists on these metrics because search campaign architecture requires sustained optimization that broad-channel firms deprioritize.
Paid social specialists focus on Meta (Facebook and Instagram), TikTok, Pinterest, and LinkedIn. Their core competency is creative strategy and audience structure rather than keyword architecture. These companies are the right choice for DTC and ecommerce brands where visual creative drives conversion, and for B2B brands running LinkedIn campaigns against account lists.
Amazon and retail media specialists manage Sponsored Products, Sponsored Brands, and retail media networks (Walmart Connect, Target Roundel). Amazon Ads operates on fundamentally different auction mechanics than Google, with product listing quality, reviews, and organic rank all affecting paid performance. Retail media requires category-specific expertise that search or social agencies rarely develop without dedicated practice.
Full paid media companies manage search, social, and sometimes programmatic display under one roof. They make sense for brands past $5 million in annual revenue that need integrated attribution across channels and have the budget to support a team covering multiple platforms. The risk is the same as with any generalist: width of coverage can come at the cost of depth in any single channel.
Understanding the pricing model matters because it affects incentive alignment between your business and the PPC company.

Flat monthly retainers (typically $1,500 to $5,000 per month for growth-stage accounts) align incentives toward quality: the company earns the same regardless of how much you spend. Percentage-of-spend models (10 to 20% of monthly ad spend) scale with your budget, which can misalign incentives if the company recommends increasing spend to grow its own fee. Hybrid models that combine a flat management fee with a smaller performance fee attempt to align incentives across both quality and scale.
Seventy-two percent of PPC companies white-label their services, meaning the firm you hire may be reselling capacity from a larger operation, per Stackmatix's agency model analysis. This is not inherently a problem, but it matters for understanding account team continuity and escalation paths when campaigns underperform.
In-house PPC specialists cost $100,000 or more annually in salary alone, with additional benefits and management overhead. The break-even between agency and in-house typically lands around $500,000 to $1 million in annual ad spend, at which point the management fee percentage compresses and in-house control becomes more cost-effective. Below that threshold, a PPC agency provides broader platform expertise at lower cost than a full-time hire.
New PPC relationships follow a predictable ramp pattern. Understanding what to expect prevents premature termination of relationships that are still in the learning phase.
Days 1 to 30 are onboarding: account access, historical data review, campaign restructuring if needed, and initial tracking validation. This period should produce a documented 90-day plan with measurable milestones, not just activity reports. Weeks 5 to 8 are the first optimization cycle: bid adjustments, negative keyword additions, ad copy testing, and audience refinement. Visible ROAS improvement typically appears in this window for accounts with adequate data volume.
Days 61 to 90 mark the end of the primary learning phase for most platforms. Google's Smart Bidding algorithms require approximately 30 to 50 conversions per campaign to stabilize, which means low-volume accounts take longer. By month 3, a competent PPC management company should be able to show a clear trend line and attribution-validated results. Months 4 through 6 represent steady state: ongoing optimization rather than structural rebuilds, with performance benchmarks holding or improving.
The most reliable signal of a failing PPC relationship is not poor ROAS in month one. It is the absence of a clear optimization log, unexplained structural changes, or reporting that does not connect spend to pipeline or revenue.
Six criteria consistently separate high-performing PPC companies from ones that manage to look competent during the sales process.
Platform certification and specialization depth. Google Partner and Premier Partner status indicates baseline platform proficiency but is not sufficient on its own. Ask specifically: how many accounts does each strategist manage? More than 8 to 10 active accounts per person means reactive rather than proactive management.
Attribution methodology. PPC companies that cannot explain their attribution model are optimizing toward last-click conversions and missing the contribution of earlier touchpoints. First-click, linear, and data-driven attribution models tell materially different stories about which campaigns and keywords are working.
Vertical experience in your category. A company that manages B2B SaaS campaigns and DTC apparel campaigns simultaneously has shallow expertise in both. Ask for reference clients in your specific business model and revenue stage.
The following three criteria evaluate execution quality once you have narrowed your shortlist to structurally qualified candidates.
Creative capability for paid social. If you are hiring for paid social, the company's creative production process matters as much as its media buying. The best PPC agencies running social campaigns have in-house or dedicated creative resources, not just access to a stock asset library.
Reporting structure. Monthly reports that show impressions, clicks, and CPC without connecting to revenue or leads are activity reports. A performance-oriented company provides revenue attribution, pipeline contribution, and trend analysis relative to agreed benchmarks.
Contract terms. Avoid contracts longer than 6 months without a performance-based exit clause. A company confident in its results does not need to lock clients in for 12 months to protect revenue.
The decision between in-house and outsourced PPC management depends on spend volume, channel complexity, and internal bandwidth.
Below $50,000 in monthly ad spend, a specialist PPC advertising agency almost always provides better value than an in-house hire. The fee as a percentage of spend is reasonable, the agency brings cross-account pattern recognition that a single in-house hire cannot replicate, and the flexibility to scale up or down without headcount decisions is operationally valuable.
Between $50,000 and $200,000 in monthly spend, the calculus shifts toward hybrid models: an in-house channel lead overseeing agency execution, or a fractional performance marketing director managing a specialist agency. Above $200,000 in monthly spend, in-house specialists with agency support for specific platforms typically outperforms full agency management, because the institutional knowledge value and response time benefits of in-house execution justify the fixed cost.
For ecommerce and DTC brands building paid media programs that need demand generation infrastructure before scaling spend, EmberTribe works on the content and search visibility programs that reduce paid CAC before the PPC budget scales.
The ecommerce statistics that matter most are not the ones that confirm what you already believe. They are the ones that force you to reconsider where to invest, how to price, and which channels to prioritize. This post compiles verified 2025-2026 data across market size, mobile, social commerce, and conversion benchmarks so you can make decisions grounded in evidence.
Before diving into each category, here is a summary of the most actionable benchmarks for DTC and growth-stage ecommerce brands in 2026.
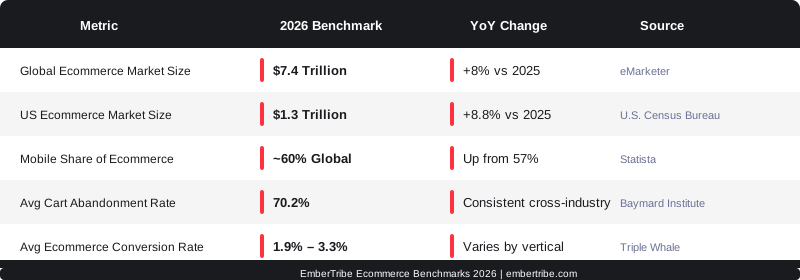
Global ecommerce sales are projected to reach $7.4 trillion in 2026, up roughly 8% from an estimated $6.86 trillion in 2025, according to eMarketer. Ecommerce now accounts for approximately 20.5% of all global retail sales, up from 19.9% in 2024. China's outsized online retail penetration is lifting the global average significantly.
For brands building long-term plans, Grand View Research projects a CAGR of 21.6% from 2026 to 2033 for the broader ecommerce ecosystem when alternative commerce models (marketplaces, social, B2B digital) are included. The takeaway: the market is expanding faster than most incumbent retail categories, but that also means competitive pressure on customer acquisition is rising in parallel.
If you are building an ecommerce strategy from scratch or looking to expand internationally, understanding the scope of the market is a prerequisite. See our guide to building an ecommerce business for a framework on how to position within this landscape.
The United States ecommerce market reached approximately $1.23 trillion in 2025, and 2026 projections point to $1.3 trillion, representing growth of around 8.8%, per the U.S. Census Bureau's quarterly retail ecommerce report. That compares to total retail sales growth of just 2.8% in the same period, underscoring how consistently ecommerce is outpacing in-store shopping.
US ecommerce penetration as a share of all retail is expected to reach 18% in 2026, up from approximately 17.1% in 2025. The gap between online and offline growth is narrowing year over year, which means brands that have already built their digital infrastructure are better positioned than those still catching up.
Mobile commerce accounted for approximately 60% of global ecommerce sales in 2026, up from 57% the prior year. In the US, mobile's share sits at 44.6%, reflecting a market where desktop still drives meaningful volume but mobile is clearly the channel of first contact. During the 2025 holiday season, mobile represented 56.4% of all online sales (November 1 through December 31), up from 54.5% in 2024.
Approximately 1.65 billion people will shop via smartphone in 2026, nearly one in three internet users globally. For DTC brands, that number has a direct implication: your mobile checkout experience is not a secondary priority. Slow load times, multi-step forms, and non-native payment options (no Apple Pay or Shop Pay) are conversion killers at scale.
The mobile commerce market itself is projected to grow from $2.42 trillion in 2026 to over $5 trillion by 2034 at a CAGR of 9.5%. Brands that invest in mobile-first site performance now are building durable advantages.
Social commerce is maturing from a novelty into a reliable channel. TikTok Shop's global gross merchandise value (GMV) reached $64.3 billion in 2025, nearly doubling from $33.2 billion in 2024, and the platform is projected to hit $112.2 billion in GMV by 2026. In the US, TikTok Shop generated $15.82 billion in GMV in 2025, representing 120% annual growth.
TikTok Shop now holds approximately 20% of total social commerce in the US, per eMarketer. The platform counts over 15 million active merchants globally and 475,000 US-based shops as of 2026. Nearly 58% of TikTok's 2 billion active users have shopped directly within the app.
For DTC brands, TikTok Shop is no longer optional to evaluate. The brands capturing share are those building authentic content pipelines (not just paid ads) and integrating creator affiliate programs with real product economics. The channel also compresses the discovery-to-purchase funnel in ways that traditional paid social cannot replicate. For a broader view of how to integrate social into your full funnel, see our breakdown of ecommerce digital marketing.
The global average ecommerce conversion rate sits between 1.9% and 3.3%, depending on vertical and traffic source. Shopify stores typically land in the 2.5% to 3% range. Reaching 4% or higher generally requires a combination of strong brand awareness, optimized UX, and consistent CRO investment, according to Triple Whale's 2025 benchmark data.
Industry-level variation is substantial. Food and beverage converts at 3.21% on average, beauty and personal care sits at 2.98%, and electronics drops to 2.71%, partly due to higher price points and longer consideration cycles.
AOV is one of the strongest predictors of conversion rate: stores selling products under $60 see median conversion rates of 4.63%, while stores with average orders above $200 see median rates closer to 0.95%.
Cart abandonment remains a persistent challenge. Baymard Institute's aggregated research, compiled from 50 studies, puts the average cart abandonment rate at 70.2%. The primary drivers are unexpected shipping costs at checkout (cited by 55% of abandoners), complicated checkout flows (21%), and trust concerns (17%). Abandoned cart email sequences still represent one of the highest-ROI recovery tactics available, with open rates around 41.8% and conversion rates near 10.7%.
Acquisition cost pressure makes retention economics more critical than ever. The average ecommerce repeat purchase rate is 28.2%, meaning slightly over one in four customers returns without additional acquisition spend. Brands above 40% are typically operating with subscription mechanics or high-frequency consumable products.
The financial case for retention is straightforward: the top 20% of customers typically account for around 80% of sales, and retained customers spend up to 67% more than new ones over time. For DTC brands scaling past $5M in annual revenue, a retention strategy is not an optional optimization, it is a core P&L lever.
Understanding how to sustain this growth over time requires a clear view of the trajectory. See our analysis of ecommerce growth strategies for brands moving into their next revenue tier.
The macro numbers confirm that ecommerce is growing, but the operational benchmarks are where the real decisions live. A 70% cart abandonment rate means that on average, seven out of ten shoppers who intend to buy do not complete the transaction. A 2% conversion rate means 98 out of 100 visitors leave without purchasing. These are not alarming outliers; they are the baseline most brands operate against.
The brands that compound growth are the ones that treat these benchmarks as specific problems to solve, not background noise. That means investing in mobile UX before mobile revenue justifies it, building TikTok Shop infrastructure before competitors saturate it, and building email and SMS retention programs before paid CAC forces the issue.
If you want to understand how your current metrics stack up and where to prioritize, EmberTribe works with DTC and growth-stage ecommerce brands to build data-driven marketing strategies that improve conversion, retention, and channel efficiency. The numbers above are the benchmark. The goal is to beat them.
The biggest ecommerce news story of 2026 is not a single event. It is a set of structural shifts that are changing how brands acquire customers, fulfill orders, and compete for attention. Global online retail is closing in on $7 trillion in annual sales, and the platforms, technologies, and regulations shaping that market look meaningfully different than they did two years ago.
For DTC brands and growth-stage companies, staying current with the ecommerce industry news that actually matters requires filtering signal from noise. This post covers the five shifts with the most direct impact on how brands operate and grow in 2026.
The numbers are large, but the trajectory is what matters. According to Statista's ecommerce market forecast, global ecommerce sales reached $6.86 trillion in 2025, representing 8.3% year-over-year growth. The 2026 projection lands at $6.88 trillion, accounting for 21.1% of all global retail, up from 19.9% in 2024.
The US market continues to grow, but the fastest-moving regions are Southeast Asia (18.6% projected growth, on track for $230 billion GMV) and Latin America. These numbers matter for US-based brands building international expansion strategies.
The share-of-retail figure is the more important benchmark. Crossing 21% means ecommerce is no longer a secondary channel for most categories. It is the primary or co-primary sales environment. Brands that still treat their online store as a supplement to physical retail are increasingly out of step with where their customers are buying.
Online retail is also concentrating. Amazon, Walmart, and a small number of major platforms continue to capture a disproportionate share of volume, which makes owned-channel strategy, particularly direct-to-consumer email and loyalty, more valuable for independent brands.
For a detailed breakdown of how to build a growth engine on top of these trends, see our guide to ecommerce growth.
The social commerce story in 2026 is largely a TikTok Shop story. According to EMARKETER, TikTok Shop grew US sales by 407% in 2024, then added another 108% in 2025, reaching $15.82 billion. 2026 projections put US sales above $20 billion. Globally, TikTok Shop's GMV is forecast to hit $112.2 billion in 2026.
The platform now commands 18.2% of total US social commerce, with that share expected to climb to 24.1% by 2027. More than half of US social media shoppers will make a purchase on TikTok in 2026, a milestone that shifts the platform from "emerging channel" to a required consideration in most consumer brands' channel mix.
What makes this different from earlier social commerce attempts is the native purchase flow. Users discover, evaluate, and convert without leaving the app. That shortens the funnel dramatically and changes the economics of content investment. Brands that can produce authentic short-form video consistently are seeing cost-per-acquisition advantages that paid search and display cannot match in certain demographics.
The practical implication: social commerce is not a replacement for owned channels, but ignoring it means ceding reach to competitors who have figured out the format. The brands winning on TikTok Shop in 2026 treated it as a distribution channel with its own content logic, not an extension of their existing ad creative.
AI in ecommerce moved from a competitive advantage to a baseline operational expectation faster than most forecasts predicted. According to data from EComposer's analysis of AI ecommerce statistics, 77% of ecommerce professionals now use AI tools daily, and 84% of ecommerce businesses are either actively integrating AI or in active planning to do so.
The revenue impact is measurable. Businesses implementing AI personalization report an average revenue lift of 10-40%, and 89% report positive ROI with a payback period averaging nine months. Personalized product recommendations alone can drive up to 31% of a store's revenue.
The highest-value applications in 2026 are not the most visible ones. Personalization engines, AI-driven product search, and dynamic pricing models are delivering the most consistent ROI. Customer service automation is reducing support costs meaningfully without degrading satisfaction scores when implemented with appropriate human escalation paths.
The threshold question for most brands is no longer whether to adopt AI tools but which ones integrate with their existing stack and which problems have the clearest return. For brands just beginning to evaluate options, our guide to ecommerce digital marketing covers how AI is changing channel strategy specifically.
Consumer expectations around delivery have reset. The ShipBob 2026 Fulfillment Trends Report shows that 80% of consumers now expect same-day delivery options, 67% of US consumers consider same-day availability a factor in purchase decisions, and 28% have abandoned a cart because estimated delivery was too slow.
The same-day delivery market reached $14.7 billion in 2025, growing at 20.8% annually. Amazon's continued investment in one-day and same-day Prime shipping has effectively set the delivery standard that independent brands now have to compete with or at least narrow the gap on.
The strategic response for independent DTC brands is distributed inventory. Rather than fulfilling from a single warehouse, more brands are pre-positioning inventory in regional fulfillment centers close to population clusters. This reduces transit times and shipping costs simultaneously. Third-party logistics providers have built infrastructure around this model, making it accessible to brands that are not at Amazon-scale volume.
Automation is also accelerating inside fulfillment operations. Robotic picking and AI-driven demand forecasting are reducing labor costs and improving order accuracy. The 87% same-day fulfillment rate benchmark from 2025 peak season data illustrates what well-resourced operations can achieve when technology and distributed inventory work together.
For brands earlier in their operations journey, the first priority is not robotics. It is choosing fulfillment partners with the network density to enable two-day shipping to most US addresses at a cost that preserves margin.
The privacy landscape in 2026 is the most complex it has ever been for US ecommerce operators. Three states (Indiana, Kentucky, and Rhode Island) added comprehensive consumer data privacy laws on January 1, 2026, bringing the total number of active US state privacy statutes to more than two dozen. The pattern across all of them is consistent: expanded consumer rights over personal data, stricter limits on data sale and sharing, and new duties for businesses collecting that data.
Several developments have direct operational implications for ecommerce brands. California's CCPA updates, effective January 1, 2026, expanded the definition of sensitive personal information, added cybersecurity audit requirements, and strengthened protections for data involving minors. Oregon now bans the sale of precise location data. Multiple states require opt-in or opt-out mechanisms for targeted advertising to users under 16.
The Global Privacy Control (GPC) signal is now effectively mandatory in California, Colorado, Connecticut, and Oregon. Brands that have not implemented GPC compliance face real enforcement risk. According to IAPP's coverage of the new state requirements, 2026 marks a shift from law creation to law enforcement, with regulators now applying the settlement precedents and technical expectations established over the last two years.
For brands running retargeting, behavioral advertising, or third-party data partnerships, an audit of data practices against current state requirements is not optional. The Ketch 2026 privacy law overview provides a useful state-by-state reference. The cost of non-compliance, including potential seven-figure settlements for GPC failures, now exceeds the cost of getting compliant.

The five trends above are not separate stories. They interact. A brand that adopts AI personalization but ignores privacy compliance is building on a foundation that regulators will challenge. A brand that masters social commerce but lacks the fulfillment speed to deliver within two days will lose repeat purchase rate to competitors who do.
The ecommerce updates that matter most in 2026 are the ones where multiple forces converge.
For brands assessing where to start, the highest-leverage moves are:
First, audit your data practices against current state privacy requirements before adding new tracking or retargeting capabilities. Compliance is cheaper before an investigation than after. Second, evaluate your fulfillment network against the same-day and two-day benchmarks your customers now expect.
Third, prioritize AI tools that have clear, measurable ROI within your existing stack rather than deploying AI broadly. Fourth, develop a content strategy for at least one social commerce channel, even if TikTok Shop is not your primary revenue driver today.
Understanding how the ecommerce industry news cycle translates into specific business decisions is something we work through with brands at every stage. If you are building a DTC operation or scaling an existing one, how to start an ecommerce business covers the foundational decisions that upstream all of the trends covered here.
EmberTribe partners with DTC brands and growth-stage ecommerce companies to build content and marketing systems that compound over time. If the trends in this post are shaping decisions you are navigating right now, we would like to talk. Visit embertribe.com to learn more about how we work.


.svg)