
Most Shopify stores are not under-tracked. They are over-reported. GA4 shows one revenue number, Shopify shows another, Meta claims it drove the sale, and Klaviyo claims credit too.
The average ecommerce team runs 17 to 20 platforms in their martech stack, yet 65% still cite data integration as their single biggest barrier to effective measurement. The problem is rarely a shortage of data. It is a shortage of the right tools, configured for the right questions.
This guide organizes the best ecommerce analytics tools by function so you can match each one to your business stage and budget, instead of buying everything at once and measuring nothing well.
Ecommerce analytics tools fall into four layers, and each layer answers a different question. Buying a Layer 4 profit analytics platform before you have clean Layer 1 tracking is like installing a turbocharger on a car with a broken engine.
The framework below moves from foundational to advanced. Most brands should start at Layer 1, validate that tracking is accurate, then add each subsequent layer as revenue and ad spend scale.

Google Analytics 4 is the standard starting point for any ecommerce store. It covers sessions, traffic source, conversion events, and basic funnel analysis at no cost. The trade-off is configuration overhead: GA4 requires proper event tracking, conversion goal setup, and custom channel groupings to be genuinely useful.
For stores under $1M in annual revenue, GA4 is the right primary analytics tool. For stores spending $20K or more per month on paid media, it is a necessary foundation but not a sufficient attribution solution.
Shopify's native analytics dashboard is included with every plan and requires no setup. It surfaces sales by channel, customer reports, and conversion rates directly from your store's transaction data. The limitation is scope: it only sees what happens inside Shopify, not the full marketing picture that drives customers there.
Use Shopify Analytics for operational decisions (top products, peak times, return rates) and a dedicated attribution tool for channel-level decisions.
Microsoft Clarity provides heatmaps and session recordings for free. It shows where users drop off, which elements get clicks, and how far people scroll on product and checkout pages. For diagnosing conversion problems, it is one of the highest-leverage free tools available. Pair it with your CVR data from Shopify to form testable hypotheses before running CRO experiments.
Once you are spending consistently on paid media across Meta, Google, and TikTok, platform-reported ROAS becomes unreliable. Each platform takes credit for conversions with overlapping attribution windows, inflating individual channel numbers by 20 to 60%. This is where purpose-built attribution tools become essential.
For a broader comparison of attribution approaches, see our breakdown of analytics platforms for DTC and SaaS brands.
Triple Whale is the dominant attribution platform for Shopify-first DTC brands. It pulls data from Shopify, Meta, Google, TikTok, and email into a single dashboard with real-time reporting and sub-3-second load times. Pricing starts at $129 per month, making it accessible for brands at the $500K to $5M revenue stage.
Triple Whale's strength is its unified "Pixel" that tracks individual purchase journeys across channels, giving you a single view of blended CAC and true ROAS. It also includes creative analytics so you can see which ad creatives are actually driving revenue, not just clicks.
Northbeam takes a different approach, combining multi-touch attribution with media mix modeling (MMM). It is built for brands with complex, multi-channel marketing setups and starts at around $1,000 per month. The investment makes sense once you are spending $100K or more per month on paid media and need modeling-level precision for budget allocation.
Northbeam is more configurable and better suited to brands that run both direct-response and brand-building campaigns simultaneously. For straightforward Shopify DTC operations, Triple Whale typically offers better value at lower spend levels.
Rockerbox sits between GA4 and Northbeam in terms of complexity and cost. It excels at unifying ad platform data with Shopify revenue in a clean, rules-based attribution model. It is a strong choice for brands that want more than GA4 offers but are not yet ready for the investment of Northbeam.
Owned channel performance belongs in a separate category because it answers a different question: how much of your revenue comes from customers you already have?
Klaviyo is the standard email and SMS platform for Shopify brands, and its analytics layer is more useful than most teams realize. Klaviyo attributes revenue directly from campaign to purchase with segment-level granularity, showing you which flows and campaigns are driving repeat purchases and which audience segments have the highest LTV.
Healthy ecommerce stores derive 25 to 40% of total revenue from email and SMS. If your owned channel share is below 15%, Klaviyo's analytics will quickly show you where the opportunity lies. Pricing is free up to 250 contacts, making it accessible at every stage.
For a deeper look at how analytics and email work together to build retention, see our guide on ecommerce analytics metrics that drive growth.
For brands running dedicated SMS programs, both Postscript and Attentive provide channel-level revenue attribution, opt-in source tracking, and A/B testing for SMS campaigns. The distinction matters because SMS subscribers often convert at 2 to 4 times the rate of email subscribers, and understanding which acquisition sources produce the highest-value SMS subscribers requires platform-native analytics.
This layer answers the question that earlier layers cannot: are the customers you are acquiring actually profitable over time?
Lifetimely is purpose-built for Shopify profit and customer analytics. It tracks contribution margin per order (factoring in COGS, shipping, and ad spend), runs cohort LTV analysis by acquisition source, and produces a profit and loss view that connects marketing spend to net margin. This is the tool that reveals whether a high-ROAS channel is actually generating profitable customers or just high-frequency returners.
Ecommerce brands should target a 3:1 LTV to CAC ratio as a baseline health benchmark. Lifetimely makes that calculation visible at the channel and cohort level, not just as a business-wide average.
BeProfit and Glew serve similar functions: pulling Shopify order data, COGS, and ad spend into profitability dashboards. BeProfit is more focused on unit economics per SKU and order, while Glew adds broader customer segmentation and channel analytics. Both are strong choices for brands that want profitability visibility without building custom data infrastructure.
StoreHero is a newer entrant focused on connecting ad efficiency to unit economics in a single dashboard. It is particularly useful for brands running multiple channels simultaneously and wanting to see contribution margin impact by campaign in near-real-time.
Choosing tools based on current revenue and ad spend avoids over-investing in complexity before you need it.
Under $500K ARR: GA4, Shopify Analytics, Microsoft Clarity. Focus on clean event tracking and understanding where conversion is breaking down before spending on attribution tools.
$500K to $2M ARR: Add Triple Whale once paid ad spend reaches $10K to $20K per month. Add Klaviyo from day one if you are running email. This stack answers the core questions at a cost that makes sense.
$2M to $10M ARR: Add Lifetimely or BeProfit for profitability visibility. Evaluate Northbeam if you are running heavy cross-channel campaigns and need media mix modeling. Your analytics budget at this stage should be 1 to 3% of total ad spend.
$10M and above: Consider a dedicated data warehouse (Snowflake or BigQuery) with a BI layer on top. At this stage, custom reporting built on first-party data often outperforms any off-the-shelf tool. For a broader view of how enterprise analytics stacks are assembled, see our guide to marketing analytics tools and how to choose the right stack.
The most common failure is purchasing attribution tools before fixing the tracking underneath them. If GA4 is missing conversion events, if Shopify orders are not being attributed to the right source, or if UTM parameters are inconsistently applied across campaigns, every layer on top of that foundation will report inaccurate data.
Before evaluating Triple Whale or Northbeam, audit your GA4 setup for event tracking completeness, verify that your Shopify order data is clean, and confirm that all paid campaigns use consistent UTM conventions. Attribution tools surface and amplify what is already in your data. They cannot fix a broken foundation.
A solid analytics stack built on accurate first-party data is the foundation of every paid media decision, budget allocation, and retention strategy that scales. The tools are available at every price point. The discipline to configure them correctly, and to act on what they report, is the actual differentiator.
Most growth-stage brands treat channel marketing as a reach problem. They add channels to increase exposure and assume more distribution means more revenue. The brands that end up over-extended, margin-thin, or locked into platform dependency usually made that assumption.
Channel marketing is actually two separate problems that most companies conflate: where your product is sold (distribution channels) and how you reach buyers (marketing channels). Treating them as the same question causes allocation mistakes that compound over time.
Distribution channels are the pathways through which a product moves from brand to buyer: your own direct website, Amazon and Walmart marketplaces, wholesale and retail partners, social commerce storefronts like TikTok Shop and Instagram Shopping. The question here is where the transaction happens.
Marketing channels are how you reach and influence buyers before the transaction: paid social, SEO, email, SMS, influencer, retail media networks. The question here is how you drive awareness and conversion.
These two dimensions interact in ways that create strategic blind spots. Amazon is simultaneously a distribution channel (where people buy) and a marketing channel (where you run Sponsored Product ads to drive discovery). A brand that runs paid social to drive DTC traffic while its own Amazon listing shows the same product at a lower price is spending against itself. Most brands discover this conflict after the fact.
The strategic framework that works: decide your distribution channel mix first, based on contribution margin and customer ownership goals. Then build the marketing channel mix to serve that distribution strategy, not the other way around.
The single most common channel selection mistake is evaluating channels by gross margin. The same $50 product can show 65% gross margin on Shopify, 60% on Amazon, and 48% at wholesale. Gross margin says DTC wins by a mile. Contribution margin, which accounts for all variable costs including CAC, platform fees, fulfillment, and returns, often tells a very different story.
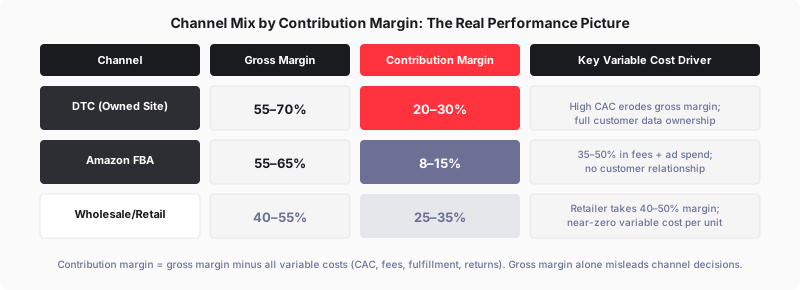
The implication is counterintuitive: Amazon's fee structure consumes 35 to 50% of revenue depending on category, but the customer acquisition cost is embedded in the platform. DTC's higher gross margin often narrows to a lower contribution margin once blended paid media CAC is included. Wholesale shows the lowest gross margin but often the highest contribution margin per unit because the variable cost per unit sold approaches zero.
Brands with strong omnichannel engagement retain 89% of customers versus 33% for single-channel brands, and omnichannel buyers show 13% higher average order value, according to research aggregated by Capital One Shopping. But reaching those retention rates requires that each channel is economically defensible first.
Early-stage and growth-stage brands face different channel problems. The right sequencing matters more than the right mix.
Early stage (pre-PMF or early traction): Marketplaces offer immediate access to existing demand without requiring you to build traffic from scratch. Amazon and TikTok Shop can prove demand faster than DTC because the platform supplies the audience. The tradeoff is that marketplace customers belong to the platform, not to you. Use early marketplace traction to validate demand, not as a long-term customer acquisition strategy.
Growth stage: DTC investment begins to compound. An email list, organic search presence, and returning customer base start delivering acquisition that does not depend on ad spend. Build owned channels in parallel before marketplace dependency becomes structural. The target allocation for most growth-stage DTC brands is roughly 60 to 70% DTC, 20 to 30% marketplace, with wholesale entering the mix once the brand has pricing leverage.
Scale stage: Wholesale and retail partnerships make sense when the brand can command premium shelf placement and pricing concessions rather than being commoditized. Omnichannel customers at this stage spend 13% more per order and have 30% higher LTV than single-channel customers.
US social commerce hit $87 billion in 2025, up 21.5% year-over-year, according to eMarketer. TikTok Shop alone grew 108% to $15.8 billion, representing 18.2% of total US social commerce.
TikTok Shop converts at 4.7% compared to Instagram Shopping at 2.1%. For mid-price visual products in beauty, wellness, and apparel, social commerce has become a first-tier channel, not an experiment.
The platform dependency risk is equally significant. TikTok's regulatory uncertainty in early 2025 demonstrated what happens when a channel that represents 15 to 20% of a brand's revenue faces potential shutdown. Brands with first-party data assets (email lists, SMS subscribers, loyalty programs) had a mitigation path. Brands without them had no way to reach those customers outside the platform.
The rule that applies to every channel: no single platform should exceed 60% of total revenue. This is not just a margin rule. It is a business continuity rule.
Channel conflict is one of the most expensive and most preventable mistakes for growth brands. It happens when distribution channel expansion creates direct competition between the brand's own channels or between the brand and its partners.
The Amazon versus DTC conflict is the most common form. If a third-party seller lists your product on Amazon at a lower price than your DTC site, customers find you through paid ads, check Amazon for the price, and buy there at lower margin. If you discount to win the Amazon Buy Box, retail partners demand matching price concessions. Margin pressure cascades.
The wholesale versus direct conflict creates similar tension. Retailers who carry your product will pull back, demand exclusivity, or reduce shelf space when they see aggressive DTC pricing. This is why many brands run channel-exclusive SKUs or colorways to prevent direct price comparison across channels.
Practical approaches that manage this without eliminating channel diversification:
The brands that manage channel conflict effectively address it in channel policy before expansion, not in crisis management after a partner complaint.
Brands with 90% or more Amazon concentration trade at 3.0 to 3.5x EBITDA at acquisition, compared to 4.5 to 5.5x for brands with meaningful off-Amazon channels, per Canopy Management's analysis of ecommerce brand acquisitions. Single-channel dependency carries a roughly 40% valuation discount.
Platform risk includes algorithm changes, fee increases, policy shifts, regulatory action, account suspension, and competitive moves (Amazon launching a private-label product in your category). The mitigation is building owned channels that the platform cannot take away.
Owned channels worth prioritizing in order of defensibility: email list, SMS subscribers, loyalty program membership, organic search presence. These compound over time and do not reset when a platform changes its algorithm or fee structure.
For DTC brands building their ecommerce marketing strategy, channel diversification is not about pursuing every available channel. It is about building the owned-channel foundation that makes all other channels less risky.
In B2B SaaS, channel marketing refers specifically to indirect go-to-market through partner ecosystems. The structural logic is the same as ecommerce channel strategy, with different vocabulary.
Partner types include resellers and value-added resellers (VARs), managed service providers (MSPs), independent software vendors (ISVs) who integrate your product, referral and affiliate partners, and system integrators for enterprise deployments.
The economics make indirect channels necessary at certain ACV thresholds. If your average contract value is below $15,000 to $25,000, a direct enterprise sales rep for every deal is not economically viable. Partners cover that market cost-effectively. Forrester research cited across B2B practitioners estimates that nearly 70% of B2B buyers purchase through an indirect channel partner rather than directly from the vendor.
The same channel conflict logic applies: if your direct sales team sells into territories where a partner is also working, conflict erupts. Deal registration systems, territory exclusivity agreements, and Partner Relationship Management (PRM) tools like PartnerStack or Impartner are the B2B equivalent of MAP policies.
For brands building a broader omnichannel marketing strategy, the underlying principle across both DTC and B2B is identical: distribution channel decisions constrain and enable marketing channel decisions. Building them in the right sequence, with contribution margin as the scorecard, is what separates brands that scale profitably from those that grow into a margin problem.
Channel strategy is one of the highest-leverage decisions a growth-stage brand makes and one of the hardest to reverse once distribution commitments are made. Wholesale relationships, Amazon seller accounts, and retail partnerships create obligations and dependencies that take years to unwind.
Getting channel strategy right requires contribution margin visibility by channel, clear policies against conflict before it starts, and a disciplined ceiling on any single platform's share of revenue. The brands that compound fastest are not the ones that found the best single channel. They are the ones that built a mix where each channel reinforces the others without undermining their economics.
If you want to audit your current channel mix and build a program that protects contribution margin at scale, EmberTribe works with growth-stage DTC and B2B brands on the kind of channel strategy that holds up as the brand grows.

Customer loyalty campaigns return $2.71 for every dollar invested in year one. By year three, that figure compounds to $7.93 per dollar, according to Smile.io's 2025 loyalty benchmark data. The compounding effect is what separates brands that treat loyalty as a retention tactic from those that treat it as a revenue system: the math gets dramatically better the longer the program runs.
This guide covers the campaign types that drive retention, the channel economics behind email, SMS, and referral, what separates tiered programs from flat-rate approaches, and the metrics that tell you whether a loyalty investment is working.
The core dynamic is that loyalty members change their behavior in measurable ways. Members who redeem rewards spend 2.5 times more than non-members, and brands with active loyalty programs see 28% higher customer retention and 18% higher average order value, according to LoyaltyLion's 2025 ecommerce loyalty benchmarks. Higher retention directly reduces reliance on paid acquisition: every customer who makes a third and fourth purchase reduces the customer acquisition cost burden on the next campaign cycle.
The compounding effect comes from behavioral lock-in. A customer tracking toward a tier upgrade or a reward threshold has an active reason to return before the competition reaches them. That friction to switch is structural, not emotional, which makes it more durable than brand preference alone.
The strongest loyalty programs combine multiple campaign types rather than relying on a single mechanism. Each type addresses a different behavioral lever.
Points-on-purchase campaigns are the foundation of most programs and the easiest to execute. Customers earn points per dollar spent and redeem them for discounts or products. The risk is commoditization: if every brand in your category runs a points program, it stops being a differentiator. Points programs work best when the earn rate is generous enough to feel meaningful within one to two purchase cycles.
Tiered programs create aspiration and urgency. Customers at higher tiers receive better earn rates, early access, or exclusive perks, and they are motivated to maintain their tier status even when they do not need to buy. Tiered programs deliver 1.8 times higher ROI than flat points programs, per Ringly.io's loyalty benchmarks, because the tier mechanic increases both purchase frequency and average order value simultaneously.
Referral campaigns are the highest-leverage loyalty investment at the growth stage. Referred customers have a higher lifetime value, lower churn rate, and 16% higher average spend than customers acquired through paid channels, per ReferralCandy's program data. Referral programs reduce new customer acquisition cost by 40 to 60 percent when the reward structure is calibrated correctly, typically a dual-sided incentive where both the referrer and the new customer receive value.
Three additional campaign types address the relationship layer, milestone timing, and win-back mechanics that points and referral programs do not cover on their own.
VIP and early-access campaigns reward top customers with exclusivity rather than purely monetary value. First access to new products, private sales, or direct access to a founder or brand team creates a relationship layer that points programs cannot replicate. Brands in premium and lifestyle categories find that exclusivity perks outperform discount perks for high-LTV customer segments.
Birthday and milestone campaigns activate at natural moments of receptivity. Customers are more likely to convert on a promotional offer during a personal milestone than during a general sale. Klaviyo data shows birthday campaigns generate 481% higher transaction rates than standard promotional emails.
Win-back campaigns target customers who have lapsed beyond their expected purchase window. A well-structured win-back sequence with a time-limited loyalty incentive reactivates 5 to 15% of lapsed customers who would otherwise require full paid acquisition cost to recover. Ecommerce marketing programs that include win-back in the loyalty stack reduce net customer attrition without increasing acquisition spend.
The channel choice for loyalty campaign delivery has significant ROI implications.
Email remains the highest-volume channel for loyalty communication. Customer acquisition through email costs $8 to $15 per retained customer, and email loyalty sequences consistently outperform broad promotional sends in conversion rate and revenue per send, per Baesman's loyalty channel analysis. The limitation is deliverability pressure: loyalty emails in crowded inboxes require strong subject line performance to generate opens.
SMS delivers the highest per-message ROI in the loyalty stack at $71 return per dollar invested, according to Omnisend's 2025 SMS benchmarks. SMS is most effective for time-sensitive triggers: expiring points reminders, tier upgrade notifications, and limited-access sale alerts. The constraint is that SMS lists are smaller than email lists for most brands, and high-frequency SMS fatigue customers faster than email.
Push notifications through a branded app or loyalty platform occupy a middle position: higher open rates than email, lower friction than SMS, but dependent on app install rates that most DTC brands have not achieved at scale.

The 1.8x ROI differential between tiered and flat programs is driven by two mechanics. First, tiered programs create what loyalty researchers call "aspirational spend": customers purchase specifically to reach or maintain a tier status, which increases purchase frequency beyond what they would have done without the tier structure. Second, higher-tier customers receive better earn rates, which compounds the points balance and increases redemption frequency.
Flat programs are easier to implement and communicate, which makes them the right starting point for brands under $2 million in annual revenue that do not have the operational infrastructure to manage multiple tier communications. The migration from flat to tiered is worth building when annual revenue exceeds $5 million and the retention data shows meaningful differences in LTV between high-frequency and low-frequency buyers.
Four platforms dominate ecommerce loyalty infrastructure: Smile.io, LoyaltyLion, Yotpo Loyalty, and Klaviyo's native loyalty tools.
Smile.io covers points, referrals, and VIP tiers with strong Shopify integration and starts at $49 per month. It is the most commonly deployed platform for brands under $5 million in revenue. LoyaltyLion offers deeper analytics and more customizable program structures, starting at $399 per month, and is better suited to brands with complex segmentation needs.
Yotpo Loyalty integrates tightly with Yotpo's review and SMS products, making it the strongest option for brands already in the Yotpo ecosystem. Klaviyo's native loyalty tools are earlier in development but offer the deepest integration with email and SMS flows for brands already on the platform.
Three metrics determine whether a loyalty program is generating returns worth the operational investment.
Redemption rate measures what percentage of earned points or rewards are actually used. A redemption rate below 20% signals that the earn rate is too low or the reward options are insufficiently compelling. A rate above 80% signals that the discount liability may be outpacing the retention benefit.
Repeat purchase rate for members versus non-members is the clearest signal of program effectiveness. If loyalty members are not purchasing at meaningfully higher rates than the baseline, the program is adding cost without changing behavior.
Program contribution to revenue measures what percentage of total revenue flows through loyalty-eligible orders. Brands with healthy programs typically see 40 to 60% of revenue from members after 18 months. Below 20% suggests the program is too small relative to the total customer base to have a meaningful retention impact.
For ecommerce brands building growth programs where retention efficiency compounds over time, EmberTribe works on the demand generation and content programs that fill the top of the funnel while loyalty programs improve the return on each acquired customer.
Customer acquisition costs in ecommerce have risen 40% to 60% from 2023 to 2025 across major DTC categories, with CAC up 222% over eight years, per Yotpo's ecommerce benchmarks. That pressure is why 79% of DTC brands now employ external marketing partners, per AskNeedle's full-service vs. specialist agency research.
The question is not whether to work with an agency. It is which type, at what budget, and at what stage.
This guide covers the six types of ecommerce agencies, what each costs, how to evaluate them, and a revenue-stage framework for deciding between a full-service partner and a network of specialists.
Not every agency that describes itself as an ecommerce agency does the same work. Understanding the distinctions saves significant evaluation time.
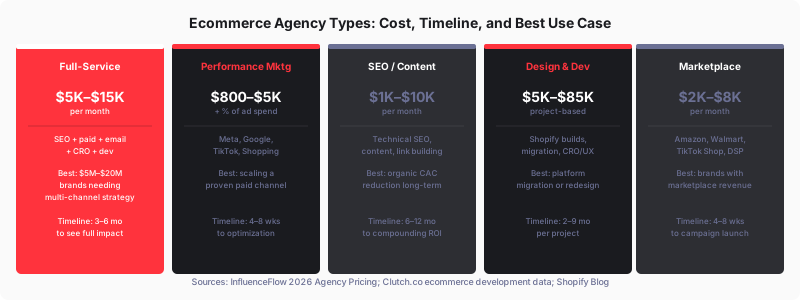
Full-service growth agencies cover the full acquisition and retention stack: paid media, SEO, email, CRO, and often development under one contract. Monthly retainers run $5,000 to $15,000 for growth-stage brands, per InfluenceFlow's 2026 agency pricing guide. The case for full-service is integrated cross-channel strategy: when paid and organic teams share data, when email nurture sequences are built from the same customer insights as acquisition campaigns, the sum is greater than the parts. The risk is depth: a shop that does everything may do nothing as well as a specialist.
Performance marketing agencies specialize in paid channels: Meta, Google, TikTok, and shopping campaigns. Fee structures typically combine a monthly management fee of $800 to $5,000 with 10% to 20% of ad spend. For brands with a proven channel they need to scale, or brands testing a new channel with aggressive ROAS targets, a performance specialist delivers faster optimization cycles than a generalist.
SEO and content agencies focus on organic acquisition: technical SEO, product page optimization, content programs, and link building. Monthly retainers run $1,000 to $10,000. The timeline to compounding ROI is six to twelve months, but the CAC differential is substantial. Ecommerce SEO packages from strong agencies produce organic traffic that compounds without proportional reinvestment, while paid acquisition cost stays linear.
Design and development agencies handle platform builds, migrations, and conversion-focused redesigns. They bill project-based: $5,000 to $85,000 per project, with average project durations of two to nine months. Brands moving from a legacy platform to Shopify Plus, building headless commerce infrastructure, or investing in checkout optimization as a standalone project are the natural fit.
Marketplace agencies manage Amazon, Walmart, and TikTok Shop presence: listings, DSP advertising, review management, and Buy Box strategy. Monthly retainers typically run $2,000 to $8,000. For brands generating significant marketplace revenue, a specialist creates substantially better outcomes than a generalist who manages the channel as an afterthought.
Strategy and consulting firms provide positioning, international expansion planning, P&L audits, and supplier strategy without execution. They serve brands needing senior-level guidance on specific decisions rather than ongoing execution partnerships.
The global digital marketing agency market is valued at $8.27 billion in 2026 and projected to reach $27.57 billion by 2035, per Business Research Insights. Retail and ecommerce command approximately 20% of US agency revenues.
The pricing range within that market is wide and reflects genuine scope differences.
Clutch's ecommerce development pricing data documents the average project cost at $51,943 over nine months for development work, with smaller builds commonly under $10,000. US-based development agencies bill $100 to $149 per hour; offshore firms below $25 per hour. For ongoing marketing retainers, the Clutch average across social media and content engagements runs $5,107 per month, or approximately $61,000 annually.
The pricing range by tier:
The in-house comparison matters here. A digital marketer costs $60,000 to $80,000 in annual salary, a social media manager $55,000 to $75,000, and a content manager $65,000 to $85,000, per Shopify's ecommerce agency guide.
An agency retainer at $5,000 to $8,000 per month replaces what would cost $180,000 to $240,000 annually in full-time staff across those three roles, before benefits, management overhead, and recruiting costs.
AskNeedle's research shows that 56% of brands work with two to three agencies simultaneously, and 66% of the most satisfied brands use multiple partners. The implication is that neither full-service nor specialist is universally correct.
The revenue-stage framework:
Under $2 million ARR: A single specialist agency maximizes ROI. Full-service overhead exceeds its value at this stage. Pick the highest-leverage channel, exhaust it, and add channels sequentially.
$2 million to $5 million ARR: One or two specialist agencies, with brand coordination managed internally. Test channel mix, identify what compounds, and build the internal marketing infrastructure that allows eventual full-service coordination.
$5 million to $20 million ARR: The inflection point. Too many channels to manage through single specialists, not enough internal infrastructure to coordinate a multi-agency stack. Full-service or an orchestrated two-to-three-agency configuration with clear internal ownership makes sense here.
Above $20 million ARR: A hybrid model: internal team plus specialist agencies for specific gaps. Build internal strategic capability; use agencies for channel-specific depth.
The questions that reveal the most about agency quality before signing a contract:
What specific results have you achieved for brands at our revenue stage and in our product category, and can you connect those results to business outcomes rather than channel metrics? Who will actually work on our account, and will we have access to that person? How do you attribute results across channels: what attribution model, what tracking setup, what does the reporting show?
How do your paid and organic teams share data? (Agencies that keep channels in silos produce worse outcomes than agencies with integrated data.) What happens in the first 30, 60, and 90 days? What is your process if a channel underperforms for two consecutive months?
Who owns our ad accounts, analytics, and content assets if we end the engagement? Can you show us a real client reporting dashboard? Can we speak with two CEO or founder references from comparable brands?
Guaranteed rankings or guaranteed ROAS. No agency can guarantee search rankings or a specific return on ad spend: channels are too variable and the variables outside any agency's control are too numerous. Pressure to sign immediately signals a poorly run sales process.
Vague case studies with no client-verifiable metrics or reference contacts. Reporting that centers on impressions, clicks, and follower counts rather than revenue, pipeline, or CAC. Cookie-cutter strategy with no customization to your product category.
An agency pitching the same channel mix to a $200 ACV software company and a $50 apparel brand does not understand the fundamental economics that should drive channel selection. Lack of clarity on who does the actual work day-to-day. High account manager turnover means your institutional knowledge walks out the door every eight months.
Channel-specific ROAS benchmarks from Foundry CRO's 2026 ecommerce marketing data: email generates $36 to $79 per dollar spent; SMS generates $71 to $79 per dollar; Google Shopping averages 5.17:1 ROAS; Meta standard campaigns average 1.86 to 2.19:1 ROAS.
Blended ROAS across channels averages 2.87:1 and is declining 4% to 10% annually as platforms capture more of the value they create.
Retention economics deserve equal weight. A 5% increase in customer retention correlates with 25% to 95% profitability gains, per Yotpo benchmarks. Existing customers convert at 60% to 70% versus 5% to 20% for new prospects.
Agencies that build acquisition-only programs and ignore retention economics produce top-line growth that does not compound into profitability.
The right ecommerce agency model depends on revenue stage, existing internal capability, and which channels have proven economics at your current CAC and ROAS. The common failure is hiring a full-service agency before the brand has enough scale to utilize the full scope, or hiring specialist agencies without the internal coordination infrastructure to make them work together.
For growth-stage DTC and ecommerce brands evaluating their agency stack, EmberTribe works at the intersection of paid acquisition and organic demand programs, building channel strategies accountable to revenue rather than managed in isolated reporting silos.
Ecommerce brands spend $92 on customer acquisition for every $1 they spend on conversion rate optimization. That ratio, documented by InvespCRO's industry research, explains why most DTC brands have a traffic problem that is actually a conversion problem. They are paying to bring visitors to stores that are structurally set up to lose them.
Ecommerce conversion rate optimization services are the systematic fix: research, testing, and design work that improves the percentage of visitors who complete a purchase. A documented CRO program produces an average 223% ROI, per We Are Tenet's CRO statistics. At a 2.5% baseline conversion rate, a 30% relative improvement on a $10 million annual revenue store is approximately $300,000 in incremental annual revenue without adding a dollar of ad spend.
Before evaluating CRO services, it helps to understand where your store sits relative to benchmarks. Littledata's study of 2,800 Shopify stores puts the platform average at 1.4%. The top 20% hit 3.2% or better. The top 10% reach 4.7% or better. Top performers exceed 11%.

The spread is not random. Traffic source has an outsized effect on conversion rate. VWO's ecommerce conversion research shows email traffic converting at 4.0% to 5.3%, organic search at 2.7%, and paid social at approximately 1.5%. Brands that run paid social as their primary acquisition channel are starting with the lowest-converting traffic type and often misattribute low conversion to creative or audience problems when the real issue is site experience.
Cart abandonment data from Baymard Institute adds the most actionable context: 70.19% average abandonment rate, with mobile abandonment at 85.65%. The top five abandonment triggers are unexpected extra costs (39% of cases), delivery time objections (21%), trust issues with credit card entry (19%), forced account creation (19%), and checkout complexity (18%). Baymard's large-scale checkout research found the average large ecommerce site could achieve a 35.26% increase in conversion rate through better checkout design alone, representing roughly $260 billion in recoverable lost orders across US and EU ecommerce.
A complete ecommerce CRO engagement runs through five phases that most brands do not execute independently.
Agency pricing for ecommerce CRO runs on a wide range that tracks closely with the scope of testing and the size of the client's traffic base. We Are Tenet's pricing data shows growth-stage brands paying $2,000 to $5,000 per month for a full retainer engagement, with enterprise-tier programs running $8,000 to $31,000 per month.
Project-based engagements for standalone audits run $2,800 to $85,000 depending on scope and agency tier. The audit-to-retainer path is common: brands commission an audit to understand their conversion gap, then convert to a retainer once the opportunity size is clear.
The in-house team alternative is rarely the cost-effective option at growth stage. A minimum viable internal CRO team (CRO manager, UX designer, data analyst, front-end developer) runs $420,000 to $650,000 annually in salaries, benefits, tools, and training, per Elsner's in-house vs. agency CRO analysis. The break-even point for hiring in-house is typically above $50 million in revenue with 200,000 or more monthly conversions generating enough volume to sustain 20 or more experiments monthly.
Several questions reliably distinguish genuine testing-and-optimization programs from design-plus-copy rebrands.
Ask specifically: what experiment generated the most revenue for a brand similar to mine, and how do you measure that? A CRO agency that measures success in conversion rate percentage rather than revenue per visitor is optimizing a metric that can be gamed. Moving low-quality traffic off the page improves conversion rate without improving revenue. The right metric is revenue per visitor.
Ask how they handle statistical significance. Agencies that run tests for arbitrary two-week windows and declare winners without reaching required sample sizes are producing noise, not signal. A competent answer references minimum detectable effect sizes, required sample calculations, and sequential testing methods.
Ask whether checkout and pricing pages are in scope. Checkout is where 35% of improvable conversion opportunity lives, per Baymard's research. If a CRO agency treats it as out of scope, they are avoiding the highest-impact surface in ecommerce.
Ask for an example of a test that failed and what they learned from it. Good CRO agencies have extensive loss libraries. Agencies that only show winning case studies are either cherry-picking results or have not been running programs long enough to accumulate meaningful learnings from failures.
The ten red flags documented by Logiciel's CRO agency evaluation guide are worth reviewing in full. The most consistently problematic: pitching tools before discussing strategy, optimizing for test volume rather than impact, and reporting on engagement metrics rather than revenue outcomes.
The traffic threshold matters. A/B tests require sufficient sample sizes to reach statistical significance within a reasonable testing window. Brands with fewer than 5,000 monthly sessions face a practical constraint: low-traffic stores cannot run valid tests fast enough to justify a full retainer program. The better approach at that stage is qualitative research and heuristic audit work, implemented as best practices rather than tested sequentially.
Above 10,000 monthly sessions, an ecommerce CRO retainer produces measurable results within two to three months. Above 50,000 monthly sessions, a full testing program running six to twelve experiments simultaneously generates compounding improvements across the funnel. The math favors CRO investment heavily: a $3,000 monthly retainer that improves conversion from 2.5% to 3.25% on a store generating $500,000 monthly revenue produces $30,000 in incremental monthly revenue, a 10:1 return.
For growth-stage ecommerce brands investing in paid acquisition while their conversion rate sits below the top 20% benchmark of 3.2%, the sequence is clear. The dollars spent acquiring traffic to an unconverted store are partially wasted. Every percentage point of conversion improvement compounds across every future acquisition dollar spent.
Ecommerce CRO services close the gap between traffic investment and revenue return. The $1 to $92 spend ratio across the industry means most brands are dramatically underinvested in conversion relative to acquisition. The documented 223% average ROI and Baymard's 35.26% checkout improvement benchmark both point to the same conclusion: for brands between 10,000 and 200,000 monthly sessions, a well-run agency engagement is likely the highest-leverage growth investment available.
For DTC and ecommerce brands building performance programs that connect paid acquisition economics to site conversion, EmberTribe works at this intersection, ensuring that demand generation spend lands on optimized experiences rather than leaking through unclosed funnel gaps.
Sixty-two percent of ecommerce businesses plan to hire within the next six months, and 55% of ecommerce professionals plan to explore new opportunities in the same period, per Cranberry Panda's 2025 hiring survey. The market is active on both sides. The brands that win the talent competition are not necessarily offering the highest salaries. They are hiring for clearly scoped roles, moving through the process quickly, and onboarding in ways that make strong candidates want to stay.
This guide covers the roles ecommerce brands are hiring most in 2025 and 2026, salary benchmarks by position, the decision between in-house and fractional talent, how specialized ecommerce recruitment agencies work, and the seven hiring mistakes that cost growth-stage brands the most.
Ecommerce hiring maps closely to revenue stage. A brand at $500,000 in annual revenue needs different roles than a brand at $10 million. Constant Hire's DTC ecommerce staffing roadmap provides a practical framework:
At $0 to $1 million: a customer service representative to handle support volume, a digital marketer to own acquisition, and a fulfillment or 3PL relationship. At $1 million to $5 million: an ecommerce manager as the P&L owner, channel specialists in paid social, email, and SEO, and a designer or copywriter for creative production. At $5 million to $15 million: a supply chain or operations manager, a retention and CRM specialist with Klaviyo fluency, and a data analyst. At $15 million and above: a CMO or head of marketing, director of operations, VP of customer experience, and a finance manager.
The roles hardest to fill regardless of stage: performance marketing managers with cross-platform fluency across Google, Meta, and TikTok Shop; ecommerce data analysts who can script, manage GA4, and interpret attribution data; and hybrid profiles who can move between channel management and creative strategy. Mid-level and specialized roles frequently extend to 31 to 60 days, with senior and technical hires often exceeding 90, per Mitratech's 2025 hiring benchmarks.
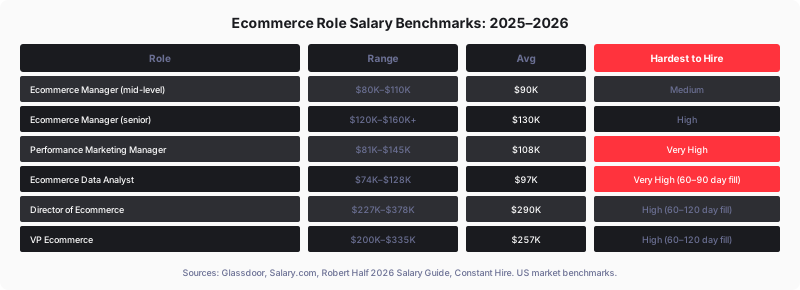
Robert Half's 2026 Salary Guide documents that 78% of marketing and creative leaders now offer higher salaries for candidates with specialized skills in AI, analytics, and automation. The premium for analytics fluency is growing faster than base salary: marketing analytics is seeing 3.3% year-over-year salary growth, the strongest category in the marketing function.
Geographic premium matters for senior roles. An ecommerce marketing manager averages $114,445 nationally but reaches $132,630 in New York City, per Salary.com. Brands hiring remotely can access talent priced at national rather than coastal rates, which is one reason remote ecommerce roles fill 16% faster than in-person roles, according to hiring data analyzed by Second Talent.
The hiring model decision depends on revenue stage and execution velocity requirements.
In-house hiring is the right choice for brands past $10 million to $50 million that need continuous campaign management, permanent marketing leadership, and forecasting beyond a single quarter. The fully-loaded cost is significant: a senior ecommerce manager runs $130,000 to $160,000 in salary alone, plus 25% to 30% for benefits, and recruiting fees of 15% to 31% of first-year compensation. A bad hire costs at least 30% of the employee's first-year pay to correct, per Soocial's bad hire statistics, and that figure rises sharply at the manager and director level.
Fractional talent is the right model for brands between $1 million and $10 million that need senior expertise without permanent overhead. A full-time marketing team might run $481,000 per year in total compensation; the equivalent fractional configuration runs approximately $220,500, a 54% savings, per ATTN Agency's fractional DTC analysis. Brands using fractional performance marketers and creative strategists report 35% faster campaign launches and 45% higher marketing efficiency at the sub-$10 million stage. The graduation threshold to full-time is typically $10 million to $50 million in revenue, where continuity and institutional knowledge become worth the permanent investment.
Recruitment agency support is appropriate for brands at $10 million or above that need to hire multiple roles annually and lack the internal recruiting infrastructure to source, screen, and close competitive candidates. Contingency recruiters charge 15% to 25% of placed first-year base salary. Retained search for director and VP level roles runs 25% to 31% of projected first-year compensation, paid in milestones.
General recruitment firms rarely understand platform-specific requirements well enough to vet ecommerce candidates accurately. A recruiter who cannot assess Shopify Plus fluency, GA4 attribution configuration, or triple-attribution tool experience (Triple Whale, Northbeam) will surface candidates with the right job titles and the wrong competencies.
Several agencies specialize in ecommerce and DTC talent. Constant Hire focuses on DTC and CPG brands and was founded by operators who scaled Shopify brands to $30 million and sold Amazon brands, giving them the operator-level vetting capability that generalist recruiters lack. eCommerce Placement covers US, Canada, and UK ecommerce from ICs to directors. Talentfoot claims a 98% placement success rate defined as placed candidates staying twelve months or longer.
Using a specialist significantly reduces the cost of a wrong hire at senior levels. The vetting gap between a generalist and a specialist recruiter matters most for roles that require hands-on platform expertise.
Constant Hire's analysis of ecommerce hiring failures documents the most consistent failure patterns:
Generic job descriptions. Vague scope with no tools specified, no budget ownership defined, and no KPIs listed. The result is a pipeline of candidates who match the title but not the actual role. Strong candidates self-select out when they cannot assess fit from the description.
Role overloading. Expecting one hire to own paid ads, email, SEO, design, and reporting. Each function requires scoped ownership. Overloaded roles attract generalists who will underperform at each function, or strong candidates who negotiate the role down after starting.
Chasing big-brand logos. Candidates from large corporations often struggle in lean, fast-moving DTC environments. The operator who scaled a Shopify brand from $3 million to $15 million with a team of four is a better fit than someone who managed a single channel at a Fortune 500 with a 20-person support staff.
Slow process. The US average time to fill a role is 36 to 44 days. Competitive ecommerce candidates are fielding multiple offers. A process that takes longer than 10 business days to reach a decision is losing candidates to faster-moving competitors.
Skipping onboarding. No 30/60/90-day plan, no documentation, no playbooks. Even strong hires underperform without context. Poor onboarding is the primary cause of failed in-house hires that otherwise had the right competencies.
Skipping reference checks. Especially common under time pressure. References reveal collaboration style and real results better than any interview process.
Hiring too late. Most DTC founders wait until they are overwhelmed to hire, which compresses the search, inflates the offer, and creates a poor onboarding environment. The right time to hire is when the role scope is clear and the outcomes are defined, not when the workload becomes unmanageable.
Ecommerce recruitment is a specialized discipline, and brands that treat it like general hiring lose their best candidates to faster, better-prepared competitors. The fractional model is the most underutilized tool in the growth-stage hiring toolkit: access to senior expertise at 46% to 54% of the fully-loaded cost, with a clear graduation path to full-time when revenue and organizational complexity justify it.
For growth-stage ecommerce brands evaluating whether their marketing function needs a full-time hire, an agency, or a fractional performance marketing team, EmberTribe works with DTC and B2B brands on the demand generation programs that generate the pipeline justifying those investments.

Most Shopify stores are not under-tracked. They are over-reported. GA4 shows one revenue number, Shopify shows another, Meta claims it drove the sale, and Klaviyo claims credit too.
The average ecommerce team runs 17 to 20 platforms in their martech stack, yet 65% still cite data integration as their single biggest barrier to effective measurement. The problem is rarely a shortage of data. It is a shortage of the right tools, configured for the right questions.
This guide organizes the best ecommerce analytics tools by function so you can match each one to your business stage and budget, instead of buying everything at once and measuring nothing well.
Ecommerce analytics tools fall into four layers, and each layer answers a different question. Buying a Layer 4 profit analytics platform before you have clean Layer 1 tracking is like installing a turbocharger on a car with a broken engine.
The framework below moves from foundational to advanced. Most brands should start at Layer 1, validate that tracking is accurate, then add each subsequent layer as revenue and ad spend scale.
Google Analytics 4 is the standard starting point for any ecommerce store. It covers sessions, traffic source, conversion events, and basic funnel analysis at no cost. The trade-off is configuration overhead: GA4 requires proper event tracking, conversion goal setup, and custom channel groupings to be genuinely useful.
For stores under $1M in annual revenue, GA4 is the right primary analytics tool. For stores spending $20K or more per month on paid media, it is a necessary foundation but not a sufficient attribution solution.
Shopify's native analytics dashboard is included with every plan and requires no setup. It surfaces sales by channel, customer reports, and conversion rates directly from your store's transaction data. The limitation is scope: it only sees what happens inside Shopify, not the full marketing picture that drives customers there.
Use Shopify Analytics for operational decisions (top products, peak times, return rates) and a dedicated attribution tool for channel-level decisions.
Microsoft Clarity provides heatmaps and session recordings for free. It shows where users drop off, which elements get clicks, and how far people scroll on product and checkout pages. For diagnosing conversion problems, it is one of the highest-leverage free tools available. Pair it with your CVR data from Shopify to form testable hypotheses before running CRO experiments.
Once you are spending consistently on paid media across Meta, Google, and TikTok, platform-reported ROAS becomes unreliable. Each platform takes credit for conversions with overlapping attribution windows, inflating individual channel numbers by 20 to 60%. This is where purpose-built attribution tools become essential.
For a broader comparison of attribution approaches, see our breakdown of analytics platforms for DTC and SaaS brands.
Triple Whale is the dominant attribution platform for Shopify-first DTC brands. It pulls data from Shopify, Meta, Google, TikTok, and email into a single dashboard with real-time reporting and sub-3-second load times. Pricing starts at $129 per month, making it accessible for brands at the $500K to $5M revenue stage.
Triple Whale's strength is its unified "Pixel" that tracks individual purchase journeys across channels, giving you a single view of blended CAC and true ROAS. It also includes creative analytics so you can see which ad creatives are actually driving revenue, not just clicks.
Northbeam takes a different approach, combining multi-touch attribution with media mix modeling (MMM). It is built for brands with complex, multi-channel marketing setups and starts at around $1,000 per month. The investment makes sense once you are spending $100K or more per month on paid media and need modeling-level precision for budget allocation.
Northbeam is more configurable and better suited to brands that run both direct-response and brand-building campaigns simultaneously. For straightforward Shopify DTC operations, Triple Whale typically offers better value at lower spend levels.
Rockerbox sits between GA4 and Northbeam in terms of complexity and cost. It excels at unifying ad platform data with Shopify revenue in a clean, rules-based attribution model. It is a strong choice for brands that want more than GA4 offers but are not yet ready for the investment of Northbeam.
Owned channel performance belongs in a separate category because it answers a different question: how much of your revenue comes from customers you already have?
Klaviyo is the standard email and SMS platform for Shopify brands, and its analytics layer is more useful than most teams realize. Klaviyo attributes revenue directly from campaign to purchase with segment-level granularity, showing you which flows and campaigns are driving repeat purchases and which audience segments have the highest LTV.
Healthy ecommerce stores derive 25 to 40% of total revenue from email and SMS. If your owned channel share is below 15%, Klaviyo's analytics will quickly show you where the opportunity lies. Pricing is free up to 250 contacts, making it accessible at every stage.
For a deeper look at how analytics and email work together to build retention, see our guide on ecommerce analytics metrics that drive growth.
For brands running dedicated SMS programs, both Postscript and Attentive provide channel-level revenue attribution, opt-in source tracking, and A/B testing for SMS campaigns. The distinction matters because SMS subscribers often convert at 2 to 4 times the rate of email subscribers, and understanding which acquisition sources produce the highest-value SMS subscribers requires platform-native analytics.
This layer answers the question that earlier layers cannot: are the customers you are acquiring actually profitable over time?
Lifetimely is purpose-built for Shopify profit and customer analytics. It tracks contribution margin per order (factoring in COGS, shipping, and ad spend), runs cohort LTV analysis by acquisition source, and produces a profit and loss view that connects marketing spend to net margin. This is the tool that reveals whether a high-ROAS channel is actually generating profitable customers or just high-frequency returners.
Ecommerce brands should target a 3:1 LTV to CAC ratio as a baseline health benchmark. Lifetimely makes that calculation visible at the channel and cohort level, not just as a business-wide average.
BeProfit and Glew serve similar functions: pulling Shopify order data, COGS, and ad spend into profitability dashboards. BeProfit is more focused on unit economics per SKU and order, while Glew adds broader customer segmentation and channel analytics. Both are strong choices for brands that want profitability visibility without building custom data infrastructure.
StoreHero is a newer entrant focused on connecting ad efficiency to unit economics in a single dashboard. It is particularly useful for brands running multiple channels simultaneously and wanting to see contribution margin impact by campaign in near-real-time.
Choosing tools based on current revenue and ad spend avoids over-investing in complexity before you need it.
Under $500K ARR: GA4, Shopify Analytics, Microsoft Clarity. Focus on clean event tracking and understanding where conversion is breaking down before spending on attribution tools.
$500K to $2M ARR: Add Triple Whale once paid ad spend reaches $10K to $20K per month. Add Klaviyo from day one if you are running email. This stack answers the core questions at a cost that makes sense.
$2M to $10M ARR: Add Lifetimely or BeProfit for profitability visibility. Evaluate Northbeam if you are running heavy cross-channel campaigns and need media mix modeling. Your analytics budget at this stage should be 1 to 3% of total ad spend.
$10M and above: Consider a dedicated data warehouse (Snowflake or BigQuery) with a BI layer on top. At this stage, custom reporting built on first-party data often outperforms any off-the-shelf tool. For a broader view of how enterprise analytics stacks are assembled, see our guide to marketing analytics tools and how to choose the right stack.
The most common failure is purchasing attribution tools before fixing the tracking underneath them. If GA4 is missing conversion events, if Shopify orders are not being attributed to the right source, or if UTM parameters are inconsistently applied across campaigns, every layer on top of that foundation will report inaccurate data.
Before evaluating Triple Whale or Northbeam, audit your GA4 setup for event tracking completeness, verify that your Shopify order data is clean, and confirm that all paid campaigns use consistent UTM conventions. Attribution tools surface and amplify what is already in your data. They cannot fix a broken foundation.
A solid analytics stack built on accurate first-party data is the foundation of every paid media decision, budget allocation, and retention strategy that scales. The tools are available at every price point. The discipline to configure them correctly, and to act on what they report, is the actual differentiator.

AI for ecommerce is no longer a future-state conversation. In 2026, 80% of online retailers have integrated AI into their operations, and the majority report measurable revenue impact. The harder question is not whether to use AI, but which applications are mature enough to justify investment right now versus which ones are still more hype than substance.
This post covers five specific use cases, what the data says about each, and where DTC brands are seeing genuine returns versus spending time on tools that are not yet ready for prime time.
Not all AI applications are at the same stage of maturity. Some, like personalized product recommendations, have been refined over years of deployment and have robust ROI benchmarks. Others, like fully autonomous ad campaign management, are still highly variable. The breakdown below focuses on what the data actually shows.
Personalization engines are the most established AI application in ecommerce. A 2025 Forrester Total Economic Impact study commissioned by Optimizely found customers achieved 446% three-year ROI with payback in under six months. BCG's 2025 Personalization Index found that leaders in personalization achieve compound annual growth rates 10 percentage points higher than laggards.
The mechanism is direct: sessions where shoppers engage with AI-powered recommendations show 369% higher average order value compared to sessions without recommendation interaction. Fast-growing companies generate up to 40% more revenue from personalization than slower-growing peers in the same category.
The caveat is that "personalization" covers a wide range of implementations. Showing recently viewed items is not the same as dynamic pricing, individualized email flows, or real-time homepage merchandising. The ROI benchmarks above apply to the more sophisticated layer, typically requiring a platform like Bloomreach, Dynamic Yield, or Klaviyo AI, and meaningful first-party data to train on. Brands without sufficient purchase history or customer data will see limited lift from personalization tools.
Site search is one of the highest-intent touchpoints in ecommerce and one of the areas where AI has quietly delivered consistent results. Shoppers who use search convert at 2 to 3 times the rate of browsers, yet poor search experiences (zero-result pages, irrelevant results, inability to handle natural language queries) have historically driven significant drop-off.
Semantic search, which interprets meaning rather than just matching keywords, has been the primary upgrade. Bloomreach customers have seen up to 8.5% more revenue per visitor with personalized search experiences. At scale, that is a meaningful revenue lever that requires no additional traffic acquisition spend.
Visual search is an emerging adjacent capability. Tools like Bloomreach's visual search allow shoppers to upload a photo and find similar products, which is particularly useful for fashion, home decor, and lifestyle categories where text-based search is inherently limited. This is still an early-stage feature for most retailers, but adoption is accelerating.
For DTC brands evaluating search tools, the practical platforms include Bloomreach, Searchspring, and Constructor.io. Each takes a different approach to balancing AI automation with manual merchandising controls, which matters for smaller teams without dedicated merchandising resources.
AI-powered customer service has become table stakes for most ecommerce brands operating at scale. The operational case is clear: stores using conversational AI report 45% fewer support tickets alongside measurable conversion improvements. The cost reduction math is straightforward when you are handling thousands of support interactions per month.
The conversion story is more nuanced. Research consistently shows chatbots can deliver 20% or higher conversion increases when proactive chat is triggered at the right moment, but the bottom 20% of implementations see no improvement and some decrease conversion by 12%. Deployment quality matters enormously.
The clearest wins are in post-purchase support (order status, returns, tracking), which can be almost fully automated. Pre-purchase consultation is where results vary more. AI agents that accurately answer product-specific questions and make genuine recommendations perform well, while those offering generic responses or escalating too aggressively erode trust.
Platforms like Gorgias AI and Intercom Fin have made meaningful progress on ecommerce-specific training, which narrows the quality gap compared to generic chatbot deployments.
AI-generated ad creative has seen rapid adoption. Nearly 90% of advertisers now use some form of generative AI in their creative workflow, up from approximately 55% at the start of 2025. The efficiency argument is strong: production timelines compress significantly and iteration speed increases.
Performance data is more qualified. Businesses report as much as a 72% lift in ROAS after implementing AI-generated ad strategies, but results are highly dependent on the quality of inputs (product data, brand guidelines, audience signals) and the specific platform. Meta's Advantage+ creative features, paired with its Lattice and Andromeda AI systems, delivered a 22% increase in ROAS for brands using the full suite in late 2025.
One pattern worth noting: AI-generated creative has historically performed best for lower-AOV products. Analysis from early 2026 shows AI creative matching human performance up to a $100 AOV threshold, up from $25 AOV parity in early 2025. For higher-AOV products, human creative direction still outperforms pure AI generation, though AI-assisted workflows (where humans brief and edit AI drafts) are narrowing that gap.
Tools like AdCreative.ai, Madgicx, and Meta's own Advantage+ suite are the most widely adopted. The honest framing: AI creative is a volume and iteration tool, not a replacement for brand strategy and creative direction.
Demand forecasting is an area where AI delivers consistent, measurable operational impact, though it is less visible than the customer-facing applications above. A Gartner study found AI-driven demand planning improves forecast accuracy by 20 to 30% over traditional methods. Brands that have implemented AI forecasting report an 18% decrease in stockouts and a 25 to 40% reduction in supply chain costs.
The constraint is data quality and history depth. AI forecasting models need 12 to 24 months of clean sales data, accurate inventory records, and ideally external signals (seasonality, promotions, social trends) to produce meaningful improvements. Brands with limited data history, inconsistent SKU tracking, or highly seasonal catalogs will see smaller gains.
Shopify's Sidekick, Inventory Planner, and invent.ai are among the practical options for DTC brands. Enterprise platforms like Oracle and Blue Yonder serve larger operations. This use case rewards brands that treat data infrastructure as a strategic asset, not an afterthought.

A few AI ecommerce applications have generated significant attention without delivering proportional results at the brand level. Fully autonomous AI agents managing entire marketing campaigns from budget to creative to audience without human oversight are still highly inconsistent. The underlying models lack sufficient context about brand positioning, competitive dynamics, and customer relationships to operate independently at this stage.
AI-generated product descriptions at scale also face a quality ceiling. Generating thousands of descriptions quickly is genuinely useful for catalog expansion, but undifferentiated AI copy does not contribute to SEO distinctiveness or brand voice. Brands treating it as a full replacement for content strategy are creating quantity without quality.
The pattern across overhyped applications is similar: AI as a complete replacement for strategic judgment does not work yet. AI as an accelerant for human decision-making works consistently.
Given the maturity landscape, brands at the growth stage should sequence investments deliberately. Personalization and AI search are proven at scale with clear benchmarks, making them the highest-ROI, lowest-risk starting points. Customer service AI for post-purchase automation is a strong second investment with fast payback.
Ad creative AI makes sense as a volume and iteration tool once those foundations are in place. Demand forecasting becomes a priority as catalog complexity and inventory carrying costs grow.
See our analysis of ecommerce digital marketing channels for context on where AI tools slot into your broader growth strategy. And if you want to understand the market-level data underpinning AI adoption, the ecommerce statistics we track include updated AI traffic and conversion benchmarks.
The brands seeing the best results from AI in 2026 are not necessarily the ones using the most tools. They are the ones who have identified one or two high-leverage applications, integrated them cleanly into existing workflows, and invested in the data quality that makes AI models perform.
If you are evaluating where AI fits in your ecommerce growth strategy, EmberTribe works with DTC and growth-stage brands to build content and paid media programs grounded in data, not trends. Get in touch to see how we approach it.
Most ecommerce brands waste significant ad budget before realizing the problem is structural, not tactical. The campaigns are live. The spend is real. But without the right service components in place, a Google Ads account becomes an expensive way to generate traffic that doesn't convert at a sustainable rate. Ecommerce PPC services are what bridge that gap between spending money on ads and building a repeatable acquisition engine.
This guide covers what those services actually include, what the right agency brings to the table, how pricing works, and what performance benchmarks you should hold your campaigns to.
Ecommerce pay per click management is not a single campaign type. It's a coordinated system of campaign structures, feed optimization, audience targeting, and conversion tracking that work together to drive profitable revenue. Top agencies build and manage all of these components.
Shopping campaigns are the foundation of most ecommerce Google Ads services. Unlike text search ads, Shopping ads pull directly from your product feed in Google Merchant Center, displaying product images, prices, and store names in search results.
Feed quality is what determines who sees your Shopping ads and how often. A strong ecommerce PPC agency audits your product titles, descriptions, GTINs, and category mappings before launching, because even well-structured campaigns underperform when the underlying feed has gaps. Google's Merchant Center Help Center outlines the technical requirements, but turning those requirements into competitive advantage is the agency's job.
SKU-level bidding is where experienced teams separate winners from losers. Segmenting campaigns by margin, conversion rate, and inventory level gives you precise control over which products get budget and at what cost.
Performance Max (PMax) gives Google's AI access to your entire inventory across Search, Shopping, Display, YouTube, Gmail, and Maps from a single campaign. It's powerful and increasingly dominant in ecommerce accounts, but it requires active management to prevent it from cannibalizing your branded terms and existing high-performing campaigns.
The core of effective PMax management is asset group architecture. A competent ecommerce PPC agency builds asset groups around product categories or customer segments, not as a single catch-all campaign. Audience signals guide the algorithm toward your best-fit customers rather than letting it learn from scratch on your budget. Negative keyword and brand exclusion lists prevent PMax from taking credit for sales that your other campaigns or organic search would have closed anyway.
For a deeper look at how PMax fits into a full paid search strategy, Store Growers' Performance Max guide is one of the most thorough independent resources available.
Text search ads complement Shopping and PMax in three specific ways: brand defense, competitor targeting, and long-tail keyword coverage. Brand campaigns protect your name in results when competitors bid against your terms. Competitor campaigns capture high-intent buyers who are actively evaluating alternatives. Long-tail campaigns reach shoppers with specific product intent that Shopping ads sometimes miss.
Search campaigns also give you direct control over messaging that Shopping and PMax don't. When you need to promote a specific offer, communicate a guarantee, or address a common objection, text ads let you say exactly what needs to be said.
Remarketing is where ecommerce PPC recaptures revenue that would otherwise leave permanently. Dynamic remarketing shows users the exact products they viewed, with current pricing and availability, as they browse other sites across Google's Display Network.
The three segments that matter most are cart abandoners, product viewers who didn't add to cart, and past customers primed for repeat purchases. Each requires different bid strategies and creative approaches. Cart abandonment campaigns typically justify the highest bids because purchase intent has already been demonstrated. Past customer campaigns often deliver the highest ROAS in an account because you're not paying to build trust from scratch.
For more on how remarketing fits into a full ecommerce Google Ads strategy, see our guide to ecommerce Google Ads agency selection.
No service component matters if you can't accurately measure what's working. Conversion tracking setup, verification, and maintenance is a core part of any serious ecommerce PPC service.
This includes confirming that purchase events fire correctly, that values pass accurately, that attribution windows align with your sales cycle, and that you have visibility into which campaigns drive new customers versus return purchases. Brands that rely on last-click attribution consistently make worse budget decisions than those with full-funnel measurement in place.
Understanding how agencies charge helps you evaluate proposals accurately and avoid structures that create misaligned incentives.
The most common model: the agency charges 10% to 20% of your monthly ad budget as a management fee. At $20,000 per month in spend, that's $2,000 to $4,000 in fees. This model scales naturally as your account grows, but it creates an incentive to increase spend before performance fully justifies it. Watch for agencies pushing budget increases before establishing strong ROAS at current spend levels.
A fixed fee regardless of spend volume, typically $1,500 to $10,000 per month depending on account complexity and agency tier. This model works well for brands with stable budgets and benefits you as spend grows without a corresponding fee increase. It also removes the perverse incentive to chase spend for its own sake.
Some agencies combine a lower base retainer with a performance bonus tied to revenue or ROAS above a threshold. When structured well, this aligns agency incentives with your actual business outcomes. When structured poorly, it can push short-term tactics over sustainable account health. Scrutinize what the performance triggers actually measure.
Resources like WordStream's PPC benchmarks and industry research from Search Engine Land can help you calibrate whether proposed fee structures are in line with market norms.
Return on ad spend is the primary performance metric for most ecommerce accounts, but raw ROAS numbers without context are easy to misread.
The standard benchmark is a 3:1 to 5:1 ROAS for ecommerce, meaning $3 to $5 in revenue for every $1 spent on ads. High-ticket categories like furniture or electronics can operate profitably at 3:1 to 4:1 because average order values are large. Fast-moving consumer goods and apparel often need 5:1 or higher to cover thin margins and return rates.
What matters more than hitting a benchmark is hitting your specific breakeven ROAS. That number comes from your gross margin: if your margins are 50%, you break even at 2:1 ROAS and become profitable above it. If your margins are 25%, you need 4:1 just to cover costs. A strong ecommerce PPC agency starts the engagement by calculating your target ROAS from your actual unit economics, not by quoting industry averages.
Attribution methodology also shifts apparent ROAS significantly. Brands measuring on last-click attribution will report higher ROAS than those using data-driven attribution or marketing mix modeling, because last-click gives full credit to the final touchpoint and ignores assists. Be skeptical of ROAS numbers from agencies that haven't disclosed how they're measuring.
For context on how PPC management fits into broader paid acquisition strategy, our guide to PPC management for ecommerce covers the full decision framework.
The service list above is table stakes. What differentiates high-performing agencies is how they apply those components to your specific business.
Business economics first. The first conversation with a serious agency covers your average order value, customer lifetime value, gross margins, and target CPA. An agency that jumps straight to campaign structure before understanding your unit economics is optimizing for activity rather than outcomes.
Feed quality as a competitive advantage. Most ecommerce brands treat their product feed as a technical requirement to satisfy, not a performance lever to optimize. Agencies that treat feed titles, attributes, and category mappings as creative and strategic inputs consistently outperform those that set and forget.
Creative involvement. In 2026, ad creative is where performance is increasingly won or lost, especially across Shopping, PMax asset groups, and remarketing display. Agencies that treat creative as something the client provides are operating with one hand tied.
Account ownership. You should own every ad account, pixel, audience list, and conversion event from day one. Agencies that house accounts under their own management umbrella and retain ownership when you leave create leverage that works against you. This is a non-negotiable.
Conversion rate perspective. The best ecommerce PPC teams treat your landing page performance as their problem, not yours. Traffic without conversion rate context leads to spend increases that improve revenue at the cost of efficiency. Look for agencies that raise CRO questions without being prompted.
For a broader view of how ecommerce digital marketing channels work together, our ecommerce marketing guide covers the full picture beyond paid search.
Ask for case studies with real numbers from brands in your category and at a comparable spend level. Broad claims about client growth don't tell you whether those results are repeatable in your competitive environment.
Request a sample reporting dashboard before you commit. The structure of an agency's reporting tells you what they think matters. Dashboards heavy on impressions and clicks with revenue buried five pages in signal a disconnect from business outcomes. Dashboards that lead with revenue, ROAS, CPA, and new customer percentage signal the right orientation.
Confirm technical setup standards: tag audits before launch, conversion testing protocols, and negative keyword management processes. Gaps in any of these create measurement errors and wasted spend that compound over time.
Finally, ask directly how they think about the relationship between PMax and Shopping campaigns. The answer reveals whether they're managing your account proactively or letting Google's automation run unattended. Both require budget.
Ecommerce PPC services done well are a systematic investment in repeatable revenue. The campaign types, the feed, the creative, and the measurement infrastructure all have to work together. When they do, paid search becomes one of the most predictable acquisition channels in your growth stack.
If you're evaluating what a structured ecommerce PPC engagement looks like, reach out to the EmberTribe team. We'll start with your unit economics and build from there.


Paid search accounts for a large share of ecommerce revenue for growth-stage brands, but running ads and running a profitable ecommerce PPC program are two different things. The channels have multiplied, automation has reshaped bidding, and customer acquisition costs have climbed 40 to 60 percent over the past two years. Brands that treat PPC as a simple traffic tap get squeezed. Those that build a structured, multi-channel strategy around real ROAS targets consistently outperform the market.
This guide covers how to build that kind of program, from channel selection to campaign structure to the benchmarks worth caring about.
Ecommerce pay per click advertising is any paid channel where you bid for placement and pay based on clicks, conversions, or impressions tied to a commercial action. The dominant channels for ecommerce brands are Google Search, Google Shopping, Performance Max, and Meta (Facebook and Instagram). Each serves a different role in the purchase funnel, and the strongest programs use all of them in combination rather than betting on a single channel.
Understanding what Google Ads is and how it works is a useful starting point before diving into ecommerce-specific strategy.
Google Shopping remains the most direct-intent ecommerce PPC channel available. Ads appear in the Shopping carousel when someone searches for a specific product, and clicks come from buyers who are already comparison shopping. The average Shopping CTR sits at 0.86 percent with an average CPC of $0.66, making it one of the more efficient traffic sources available. Conversion rates average 1.91 percent, and top-quartile ecommerce brands report Shopping ROAS above 6x.
Shopping campaigns are driven by your product feed, not keywords. Feed quality, accurate pricing, detailed product titles, and clean categorization determine who sees your ads and at what cost. Brands that invest in feed optimization see compounding gains that keyword-only campaigns cannot replicate.
Performance Max (PMax) is Google's AI-driven campaign type that runs across Search, Shopping, Display, YouTube, and Discover from a single campaign. As of 2026, PMax captures 62 percent of Shopping spend among ecommerce advertisers and is the primary campaign type for 72 percent of ecommerce brands running Google Ads. The results are real: PMax Shopping outperforms Standard Shopping by 15 to 20 percent on ROAS when conversion data is sufficient, typically 50 or more conversions per month.
The caveat is control. PMax limits keyword-level transparency and audience segmentation. Brands that run PMax alongside Standard Shopping campaigns rather than replacing them see the most consistent results. The hybrid approach lets Standard Shopping capture high-intent branded and product queries while PMax expands reach across Google's inventory.
Google's own documentation on Performance Max is available at support.google.com/google-ads.
Search ads are the right tool when you need to capture high-intent branded queries, competitor terms, or problem-aware searches that Shopping ads do not reach. Average Search CPC for ecommerce sits at $1.16, with a 4.9 percent CTR and a 2.81 percent conversion rate. The higher CPC compared to Shopping is usually justified when ads are tightly matched to transactional intent.
The most common mistake ecommerce brands make with Search campaigns is running broad match on product names without negative keyword discipline. Broad match has its place for discovery, but unchecked it inflates spend on irrelevant queries and dilutes ROAS. Exact and phrase match with a maintained negative keyword list should anchor any Search campaign before broad match is layered in.
Meta functions differently from Google. Google finds customers who are searching for what you sell. Meta finds customers by matching your offer to their interests and behaviors. For ecommerce brands, that distinction matters because Meta is better suited to cold audience acquisition, product discovery, and retargeting than it is to capturing in-market demand.
Average ecommerce CPC on Meta runs around $0.78, below Google's rates, but conversion intent is lower, so the comparison is not direct. The strongest use case for ecommerce pay per click on Meta is at the top of the funnel: building awareness for new products, reaching lookalike audiences, and retargeting site visitors who did not convert. Advantage+ Shopping campaigns now deliver 4.52x ROAS on average, 22 percent above manual campaigns, and account for 62 percent of ecommerce spend on Meta.
Meta's advertising tools and targeting options are documented at meta.com/business.
Our meta advertising guide covers campaign setup and creative strategy specific to ecommerce brands.
A high-performing ecommerce PPC budget allocation typically follows this structure:
This is a starting framework, not a fixed rule. Brands with strong brand recognition can shift more budget toward Shopping. Brands launching new products should weight Meta higher in the early stages.
Bidding strategy drives more of your ROAS outcome than most brands realize. The options that matter most for ecommerce:
Target ROAS (tROAS): Tell Google what ROAS to hit, and the algorithm adjusts bids in real time to meet it. This is the right choice once campaigns have 30 to 50 conversions per month. Campaigns with insufficient data will underdeliver because the algorithm lacks signal. Setting tROAS too aggressively restricts volume; a target of 90 to 95 percent of your actual historical ROAS gives the algorithm room to learn.
Maximize Conversion Value: Optimizes for the highest total revenue within your budget without a ROAS floor. Useful in scaling phases or when entering new product categories. Research from WordStream shows 95 percent of successful PMax campaigns use Maximize Conversion Value, achieving a median conversion rate of 2.22 percent versus 1.98 percent for Maximize Conversions.
Manual CPC: Gives precise control but demands constant monitoring. It is the right choice during campaign launches when there is no conversion history, and for branded campaigns where you want exact bid control.
Average ROAS benchmarks for ecommerce PPC in 2026:
| Channel | Average ROAS | Top Quartile |
|---|---|---|
| Google Shopping | 5.17x | 6x+ |
| Performance Max | 4.1x | 5x+ |
| Meta Advantage+ Shopping | 4.52x | 6x+ |
| Google Search (ecommerce) | 3.68x | 5x+ |
Break-even ROAS depends on your margins. A brand with a 40 percent gross margin needs at least 2.5x ROAS to cover ad spend before accounting for other costs. Most ecommerce brands need 3.5 to 4.5x on Google Search and 3.0 to 4.0x on PMax to maintain profitability. Chasing benchmark averages without anchoring targets to your own unit economics is one of the most common ways brands overspend on ecommerce pay per click.
Campaign structure determines how clearly the algorithm understands your goals. The principle is: separate campaigns with distinct intent levels should not share budgets or bidding logic.
A sound structure for an ecommerce brand running Google Ads:
Mixing branded and non-branded traffic in the same campaign lets high-converting branded queries mask poor performance from non-branded terms, which inflates apparent ROAS and hides waste.
The gap between the average ecommerce PPC program and a top-quartile one usually comes down to three factors. First, feed quality for Shopping and PMax campaigns. Second, the discipline of negative keyword management, which prevents budget from leaking into irrelevant queries. Third, consistent creative testing on Meta and Display, where ad fatigue erodes performance faster than brands expect.
Brands that track ROAS at the campaign level, monitor impression share trends weekly, and rotate creative on a set schedule tend to maintain profitability as they scale. Those that set campaigns and check results monthly tend to discover problems after they have already cost money.
If you are evaluating whether to manage ecommerce PPC in-house or with a partner, our ecommerce PPC services guide covers what a full-service program looks like and what to expect from an agency engagement.
Click-through rate and impressions are visibility metrics, not performance metrics. The numbers that drive ecommerce PPC decisions:
Attribution is a growing challenge as privacy changes have reduced Meta's pixel accuracy and multi-touch attribution has become harder to model. Brands running both Google and Meta should use data-driven attribution in Google Ads and supplement with platform reporting to build a composite picture of channel contribution.
If you are starting from zero, the sequence that works is: launch Shopping first to capture in-market demand, add Search once you have branded query volume, layer in PMax after Shopping campaigns have 50 or more conversions per month, and bring Meta in for prospecting once Google is profitable.
If you are scaling an existing program, the constraint is usually one of three things: insufficient conversion data limiting smart bidding performance, ad creative fatigue on Meta, or a product feed with gaps that limit Shopping reach. Fixing the constraint in your specific funnel produces more lift than adding new channels.
Ecommerce PPC is a compounding system, not a switch. The brands that treat it as a discipline rather than a media buy tend to build sustainable acquisition economics. Those that chase short-term ROAS by cutting bids at the wrong moment often sacrifice the volume that keeps algorithms performing.
For a broader look at how paid search fits into a full growth stack, our PPC advertising agency guide walks through what to look for in a managed program and how to evaluate performance over time.

Sixty-eight percent of Shopify stores already run an active loyalty program, and 44% of those without one are actively implementing one, according to Rivo's 2026 Shopify loyalty statistics. Loyalty platforms have moved from a competitive differentiator to baseline infrastructure for ecommerce brands. The question is no longer whether to run a program; it is which platform serves your GMV stage, tech stack, and analytics requirements.
The loyalty platform market reached $12.89 billion in 2025 and is growing at a 13.1% CAGR, per Grand View Research. With that growth has come meaningful product differentiation: the right platform for a $3 million Shopify brand is not the right platform for a $30 million multi-channel retailer.
The loyalty platform you choose determines the quality of data flowing into your marketing stack. Every platform can run points and tiers. What separates them is how deeply loyalty data integrates with your email and SMS platform, how much behavioral data they capture, and how easily you can act on that data without developer involvement.
Loyalty members who redeem rewards spend 67% more than non-members, and VIP members in tiered programs show 73% higher AOV and 3.6 times more purchases than non-VIP customers, per Rivo's VIP program benchmarks. Those numbers assume the program is actually driving behavior. A platform with weak Klaviyo integration, no tier urgency mechanics, or a redemption experience buried in a separate portal will underperform against those benchmarks regardless of how the program is structured on paper.
The market has consolidated around a small number of platforms that dominate Shopify installs. Each has a distinct GMV fit and a specific integration advantage.
Smile.io is the most-installed loyalty app on the Shopify App Store and the default starting point for most ecommerce brands. Its free tier handles basic points and referrals for stores processing up to 200 orders per month. The Growth plan at $199 per month adds VIP tiers, points expiry, and the Klaviyo Customer Hub integration that surfaces loyalty data natively inside Klaviyo's account experience.
Smile.io can be live within hours and requires no developer involvement. The ideal profile is a Shopify brand under $15 million GMV that wants quick time-to-value without complex setup.
LoyaltyLion is the analytics-first choice for brands that will actually use program data to drive decisions. Its Advanced Klaviyo Events integration is the deepest in the category: loyalty triggers, tier changes, reward milestones, and points balances flow into Klaviyo in real time with conditional logic and A/B testing built into the flow architecture. The analytics dashboard surfaces CLV, repeat purchase rate, and program ROI by cohort. Starting at $199 per month with order-volume-based scaling, LoyaltyLion fits brands between $5 million and $50 million GMV with a dedicated marketing team.
Yotpo Loyalty makes the most sense for brands already using Yotpo Reviews or operating in the Yotpo product suite. Cross-product data sharing means review activity can unlock points and subscription status can affect tier placement. The free tier handles up to 100 orders per month, and the Pro plan at $199 per month covers most growth-stage needs. One important change: Yotpo discontinued its email and SMS products at the end of 2025, which means brands now need Klaviyo or Attentive separately for loyalty communications.
Zinrelo (recently rebranded TrueLoyal) targets mid-market to enterprise brands with a focus on zero and first-party data capture and AI-driven personalization. Its multi-dimensional loyalty framework covers transactional, social, referral, behavioral, and emotional engagement rather than just purchases.
Starting at $199 per month for up to 1,000 members, Zinrelo fits brands at $10 million or above that prioritize data strategy alongside program mechanics. The setup is more complex than Smile.io or LoyaltyLion, which requires allocating internal resources to implementation.
Antavo operates at the enterprise end of the market. Its Timi AI automates program management, and its Loyalty Planner reduces program design time by 10x according to the company. Clients include KFC, Skims, and Scandic Hotels. Antavo's own platform data shows an average 5.2x ROI across its client base, per the Antavo Global Customer Loyalty Report 2025, with 83% of programs reporting positive ROI.
Pricing is custom and requires a sales process. Antavo fits brands above $25 million GMV with complex multi-brand, multi-country, or experience-based loyalty requirements.
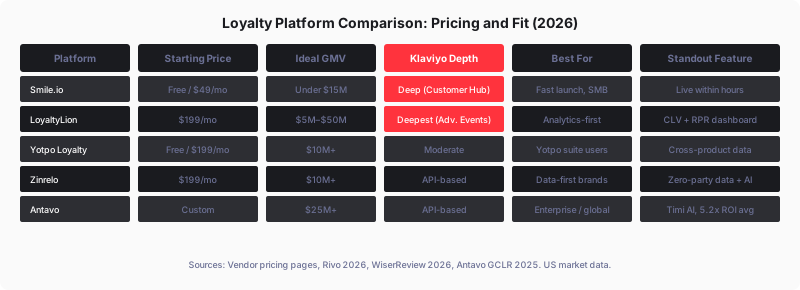
For DTC brands running email and SMS through Klaviyo, the loyalty platform is only as useful as the data it sends to Klaviyo. A platform that sends basic triggered emails but does not feed real-time tier status, points balance, and reward milestone data into Klaviyo segments cannot power the personalized flows that drive the retention benchmarks above.
LoyaltyLion's Advanced Klaviyo Events integration is the current category leader. It passes event-level data that Klaviyo can use to trigger flows, build dynamic segments, and personalize content based on loyalty status. Smile.io's Customer Hub integration is less flexible but more accessible: it surfaces loyalty data directly inside the native Klaviyo customer account portal without requiring custom development. The customer loyalty campaigns that consistently outperform are the ones where loyalty data is fully wired into the email and SMS stack, not sitting in a separate platform dashboard.
Custom loyalty platform builds cost $10,000 to $20,000 at MVP and $20,000 to $60,000 for full-featured versions, per Raftlabs' loyalty development cost analysis. First-year total costs including integrations, hosting, compliance infrastructure, and support run $30,000 to $80,000. A SaaS platform average spend is $14,200 per year, according to Rivo's platform cost data.
For ecommerce brands under $50 million GMV, SaaS loyalty platforms consistently deliver lower total cost of ownership than custom builds. SaaS platforms also ship product updates continuously, which means AI features, new channel integrations, and platform algorithm changes get incorporated without internal engineering resources. Custom builds require ongoing maintenance investment to stay current.
The only cases where custom builds make sense are brands above $100 million GMV with coalition loyalty programs, multi-country compliance requirements, or highly unique program mechanics that no platform supports. That is a narrow slice of the ecommerce market.
Enterprise migrations from legacy loyalty platforms take 4 to 12 months from decision to full decommission, per Antavo's loyalty replatforming research. The primary blockers are points balance migration accuracy, tier mapping, customer communication during the transition, and engineering bandwidth. Poor integration architecture is cited as a major challenge by 71% of loyalty program owners globally, per the Antavo GCLR 2025.
Choosing the right platform at each growth stage reduces switching frequency. The practical migration path for most DTC brands: Smile.io from launch to $5 million GMV, LoyaltyLion from $5 million to $25 million, and an enterprise platform like Antavo or Zinrelo above that. Some brands stay on LoyaltyLion past $25 million when the analytics depth and Klaviyo integration justify the continuity over a complex migration.
Across platforms and program types, the retention math is consistent. A 5% improvement in customer retention produces a 25 to 95% increase in profit, a benchmark rooted in Harvard Business School research. Customer loyalty programs that reach 40 to 60% of total revenue flowing through loyalty-eligible orders after 18 months are operating at the level that produces those margins.
For ecommerce brands evaluating their loyalty infrastructure alongside their demand generation programs, EmberTribe works on the acquisition side that fills the top of the funnel while retention programs improve the return on every customer acquired.
Most guides on how to start an ecommerce business focus on the easy part: picking a platform, setting up a store, and listing products. The hard part is surviving past year one. Only 30% of ecommerce businesses make it through their first year, according to Investopedia's startup failure analysis, and 80 to 90% fail at some point in their lifecycle. The brands that survive are not necessarily better at product selection. They are better at unit economics from the start.
The single most important thing to understand before starting an ecommerce business is that you will almost certainly lose money on your first customer. The average ecommerce brand loses money on the first transaction after accounting for acquisition cost, fulfillment, and platform fees. Customer acquisition costs across ecommerce categories average $68 to $84, according to Foundry CRO's 2026 ecommerce benchmarks. That first sale is not where you make money. The second, third, and fourth purchases are.
This math changes the entire launch strategy. A brand optimized for cheap first purchases with no retention plan will exhaust its capital before achieving profitability. A brand that acquires customers at a loss but retains them at a high rate compounds into profitability over time. Building the retention infrastructure before scaling acquisition is the most consistently predictive separator between ecommerce businesses that survive and those that do not.
Platform choice is one of the first decisions with lasting cost implications. The platform does not determine success, but it does determine the operational debt you carry from day one.

Shopify dominates new ecommerce launches for good reason. Its year-one total cost of $2,900 to $3,700 includes subscriptions, apps, and themes, and it integrates with every major fulfillment, email, and analytics platform without custom development. The transaction fee (2% for non-Shopify Payments) is a meaningful cost at scale, but at launch volumes it is negligible. For brands with very limited capital, WooCommerce versus Shopify versus BigCommerce is worth evaluating: WooCommerce year-one costs run $310 to $500 but require more technical management.
TikTok Shop represents a genuinely different launch path. With $15.82 billion in US sales and 475,000 active shops as of 2025, up 5,000% from mid-2023 according to EMARKETER, TikTok Shop has compressed the path from content to transaction for categories where visual product demonstration converts. The 6 to 8% transaction fee is higher than Shopify, but the acquisition cost can be near zero for brands with organic reach.
TikTok Shop works as a launch channel, not necessarily as a long-term platform, because customer relationships built on TikTok are owned by TikTok.
The channel selection decision at launch carries the highest leverage of any early choice. Most ecommerce businesses try to be present everywhere and spread capital too thin to see results in any channel.
Organic search and content is the highest long-term ROI channel but the slowest to produce results. It makes sense to start building it from day one, but it should not be the only acquisition strategy while SEO builds. Paid social (Meta, TikTok) is the most common launch channel because it is measurable, targetable, and can scale quickly when creative converts. Email is the highest-returning owned channel and should be built from the first transaction: even a list of 200 customers is worth more than 200 followers on any rented platform.
For brands that manufacture or own unique products, TikTok Shop and organic social commerce create an acquisition layer that did not exist five years ago. For brands in competitive commodity categories, paid search captures in-market intent that social does not. Omnichannel ecommerce strategy becomes relevant at the $1 million to $5 million revenue stage, but at launch, one or two channels executed well outperforms five channels executed poorly.
Brands that allocate 30% or more of their marketing budget to retention programs achieve significantly greater marketing efficiency than acquisition-only brands, according to Foundry CRO's 2026 ecommerce benchmarks. Retention is not just about loyalty programs. It is the full post-purchase experience: email sequences, SMS flows, review requests, repeat purchase incentives, and customer service quality.
The retention stack for a new ecommerce business does not need to be complex. An automated welcome sequence (3 to 5 emails), an abandoned cart flow, and a repeat purchase reminder at the expected repurchase interval captures the majority of the retention value. Klaviyo and Omnisend both offer these as template flows with minimal setup. Adding a simple points program via Smile.io after the first 100 customers creates the behavioral anchor that increases purchase frequency.
Ecommerce growth accelerates materially when the retention rate moves from 20% to 35%, because each percentage point of retention improvement reduces the acquisition spend required to maintain revenue. A brand with $500,000 in revenue at 20% retention needs to acquire 80% of its customers again each year. At 35% retention, that drops to 65%.
Most ecommerce failures are not product failures. They are operational and financial failures that follow predictable patterns.
Define the unit economics before spending on acquisition. Calculate the cost of goods sold, fulfillment cost, and platform fees to establish the minimum viable margin per order. If the math does not support CAC payback within 90 days for consumables or 180 days for durables, the business model needs adjustment before any acquisition spend.
Build the email list from day zero. Every customer who buys and every visitor who opts in to a pre-launch list is a relationship you own. Email is the only acquisition channel with near-zero marginal cost at scale. A 1,000-person email list is worth more at launch than any paid channel investment of equivalent cost.
Set 90-day retention targets before 90-day revenue targets. Measuring repeat purchase rate from the first cohort tells you whether the product, experience, and communication strategy is working. Revenue in the first 90 days is misleading. Retention in the first cohort predicts whether the business compounds.
Two more operational decisions have an outsized impact on first-year survival: fulfillment structure and creative investment.
Use fulfilled-by-third-party from the start if volume is uncertain. Fulfillment infrastructure is capital-intensive and hard to scale down. A 3PL arrangement converts fixed costs to variable costs and protects against the operational failure that kills otherwise viable businesses in the first year.
Invest in product photography and creative early. Ecommerce conversion rates are determined more by visual presentation than price within a 10 to 15% price band. Professional product photography and a coherent visual identity are not optional at launch; they are the primary driver of first-visit conversion.
Surviving year one is not the goal. It is the qualifier. The brands that break through the $1 million revenue threshold have almost always built a repeatable acquisition channel, achieved retention rates above 30%, and created enough operational margin to reinvest. At that stage, ecommerce marketing investment compounds because the customer base provides word-of-mouth, email list growth, and review volume that reduces acquisition cost.
For ecommerce brands building demand generation programs past the launch stage, EmberTribe works on the content and performance marketing infrastructure that drives compounding acquisition while the retention stack handles the rest.
Unified commerce is not a marketing term for an upgraded omnichannel strategy. It is a fundamentally different architectural decision: instead of connecting separate systems after the fact, unified commerce runs all channels from a single backend data layer that handles orders, inventory, customers, pricing, and loyalty in real time.
The distinction matters because the problem omnichannel was designed to solve, that customers experience friction when moving between channels, cannot be fully solved at the experience layer. The friction originates in the backend.
Omnichannel is a frontend experience strategy. The goal is to make the customer journey feel consistent across touchpoints: the same promotions online and in-store, the ability to return online purchases at physical locations, buy-online-pick-up-in-store functionality. That is valuable. It is also structurally limited.
The problem: achieving consistent experience across channels requires that separate, siloed systems stay in sync. The ecommerce platform, POS, inventory management, OMS, CRM, and loyalty program all communicate through API integrations and middleware. Every sync is a potential failure point, and every integration introduces latency.
Because each system holds its own version of truth, inventory counts, customer records, and order status can diverge in ways that only surface at checkout or fulfillment.

Unified commerce eliminates the sync problem by eliminating the silos. Every channel reads from and writes to the same data layer. When a customer buys in-store, inventory updates everywhere immediately, and when a loyalty point is earned online, it is visible at the register in real time.
There is no reconciliation because there is nothing to reconcile.
The practical consequence: omnichannel can tell a customer that an item is available for pickup. Unified commerce can guarantee it, because the inventory count is the same number the checkout system read half a second ago.
Despite being a recognized priority for years, unified commerce remains rare in practice. According to Manhattan Associates' Unified Commerce Benchmark, only approximately 7% of retailers have achieved true unified commerce maturity.
The gap between intent and execution is not primarily a technology problem. It is an organizational and migration problem.
Most retailers built their ecommerce operations by layering digital channels onto existing physical retail infrastructure. Each channel acquired its own system over time: the POS came first, the ecommerce platform was added later, the inventory management system predates both, and the loyalty program was bolted on after a rebrand.
Each system carries years of transaction history, customer records, and customizations built specifically for it. Replacing or consolidating them is a multi-year project with no clean phasing.
The specific challenges that block most implementations:
Data migration complexity. Consolidating customer records across systems that used different identifiers, address formats, and loyalty structures requires significant data modeling before a single line of migration code is written.
Organizational resistance. Different channels often have separate P&L owners. The ecommerce team and the retail operations team may not report to the same executive. Infrastructure decisions that require both to change their systems simultaneously run into jurisdictional friction that no vendor can resolve.
Platform misrepresentation. Not all platforms marketed as "unified" are architecturally unified. Some are middleware layers that create the appearance of a unified backend through faster syncing. The distinction requires examining the actual data model, not the marketing language.
The business case for the investment is strong in verified implementations. Manhattan Associates' Unified Commerce Benchmark documents consistent results across retailers that have completed the transition.
Fulfillment cost reductions of 27 to 31% emerge from real-time inventory visibility across all locations. When the order management system knows exactly what is in every store and warehouse simultaneously, it routes fulfillment to the cheapest and fastest origin rather than defaulting to the distribution center for every order.
Cart abandonment rates run 18 to 20% lower compared to omnichannel implementations. The friction that drives abandonment, inaccurate inventory displays, inconsistent pricing, and failed cross-channel promotions, is structurally eliminated rather than patched.
Average order value and customer lifetime value improve 11 to 14%. Customers who shop without friction spend more per transaction and return more often. Loyalty program engagement improves when points are visible and usable across every channel without manual reconciliation.
These outcomes are not immediate. The ROI from unified commerce is backend-heavy: the infrastructure investment comes first, the revenue impact follows over 12 to 24 months as the customer experience compounds. Planning the business case around short-term payback periods understates the actual return.
The platform market has matured significantly. Three architectures dominate serious implementations.
Shopify Plus is the most accessible path for mid-market DTC brands. Shopify's native POS integration, combined with its unified order management and inventory layers, delivers genuine backend consolidation for brands operating a manageable number of store locations. Shopify's headless capabilities allow custom frontends without fragmenting the backend data model. The ceiling on customization is lower than composable alternatives, and brands with complex B2B or wholesale pricing structures often reach it.
Commercetools is the leading composable commerce platform for enterprise retailers that need full architectural flexibility. It is API-first and component-based: retailers assemble best-of-breed services connected to a unified commerce layer rather than buying a single-vendor platform. Implementation complexity and cost are significantly higher, but the ceiling for customization reflects that complexity. Enterprise brands with multi-region operations, complex pricing rules, and unique fulfillment models are the natural fit.
Salesforce Commerce Cloud sits between the two in implementation complexity and cost. It suits brands already operating in the Salesforce ecosystem (Service Cloud, Marketing Cloud, CRM) where native data sharing across those systems reduces integration work. The advantage is that customer data flows between commerce, service, and marketing without separate integrations. The trade-off is platform lock-in and licensing costs that are harder to justify below a certain revenue threshold.
Platform selection should be driven by three variables: the current tech stack and what stays versus gets replaced, the number and complexity of channels being unified, and the internal engineering capacity to manage implementation and ongoing maintenance.
Organizations that succeed at unified commerce follow a phased approach that avoids the big-bang migration failure mode.
The phasing matters because each layer depends on the one below it. Building loyalty programs on top of fragmented customer data produces poor results regardless of the platform. Optimizing fulfillment routing without real-time inventory produces more errors than it resolves.
Unified commerce is not the right infrastructure decision for every brand at every stage. For brands operating one or two channels with manageable complexity, the coordination overhead of a unified backend may not justify the cost. Well-run omnichannel integrations remain a viable path.
For ecommerce brands operating four or more channels with significant cross-channel customer behavior, the math shifts. The compounding cost of maintaining API integrations, reconciling inventory discrepancies, and patching friction in cross-channel journeys eventually exceeds the cost of architectural consolidation. The question becomes not whether to consolidate, but when the business has the operational capacity to execute it correctly.
If you are evaluating whether unified commerce is the right next infrastructure investment for your brand, EmberTribe works with growth-stage DTC and B2B retailers on the strategy and implementation planning for commerce infrastructure decisions that affect acquisition, retention, and fulfillment economics.


.svg)